
What does the MeDReaders do?
The current version of the database allows users to:
- achieve methylated DNA binding motifs of TFs of user's interest or search potential TFs by matching methylated binding sequences as user requested.
- obtain and/or compare methylation contexts of the same TF under different cell lines and/or tissues.
- download position weight matrix (PWM) of TFs associated with methylation status (high or low methylation).
- submit newly published information of methylated-DNA binding TFs to enrich our database.
Downloading data
- A Download page have been provided. On the Download page, you can download the total records of the methylated DNA binding TFs by the link of Transcription.factor.annotation.download.xlsx. In this file, the annotations such as the TFs reference articles, the the experimental techniques, the TFs binding sequences and so on are included. The TFs motif logos can be downloaded from the link of TF.PWM.download.tar.gz. The LOGO.Names in the TFs annotations file are the names of .png files in the TF.PWM.download.tar.gz.
- We have provided a download link on the Methylome+CHIP-Seq page. On that page, the information for predicted TFs binding high/low methylated DNA can be downloaded in a .csv format. In the download file, the TF binding position, binding sequence, the methylation level on the binding sequence and peak regions and so no are provided to researchers to do further research.
Schema for the download files from the Methylome+CHIP-Seq page and the Methylated-DNA binding transcription factor data predicted in silicon on download page.
| Field | Example | Description |
|---|---|---|
| Chrom | chr1 | Reference sequence chromosome or scaffold |
| Start | 12800058 | Start position in chromosome |
| End | 12800258 | End position in chromosome |
| Name | . | Name given to a region (preferably unique). Use . if no name is assigned |
| Score | 1000 | Indicates how dark the peak will be displayed in the browser (0-1000) |
| Strand | . | + or - or . for unknown |
| SignalValue | 33.34223 | Measurement of average enrichment for the region |
| Pvalue | -1 | Statistical significance of signal value (-log10). Set to -1 if not used. |
| Qvalue | 2.26001 | Statistical significance with multiple-test correction applied (FDR -log10). Set to -1 if not used. |
| Peak | 180 | Point-source called for this peak. 0-based offset from chromStart. Set to -1 if no point-source called. |
| PeakSeq |
AGCAATCCCAGCACCATAGAGCATCAGGGGAAAG CGTCAGTATCTTTTGGAGGAATTCAACAGGCATT CAGAAAGGACCAGGAAGGCCACGGGCATGTTTGC AAAAGACTCTATAGCCAGGAAGGTAGCTGAGTTC ACAGACAGAGTATAGCAGAGTCAAGGACACATGC AAGAGAATCTAAAACACTGGTTCTCAACCTG | DNA sequence in the peak region |
| BindingSeq | GGGGTCGCGA | DNA sequence in the predicted binding site |
| BindingSeqStrand | - | + or - or . for unknown |
| MethylRatio | 0.8571 | Methylation level of the CpGs site. NA for unknown |
| AllMethylNum | 18 | Methylated read coverage of the CpGs site. for splitting. * for unknown |
| AllReadNum | 21 | Total read coverage of the CpGs site. * for unknown |
Submitting data
Welcome you to submit new research results about methylated DNA binding TFs.
Here is an example to show how to submit you result.
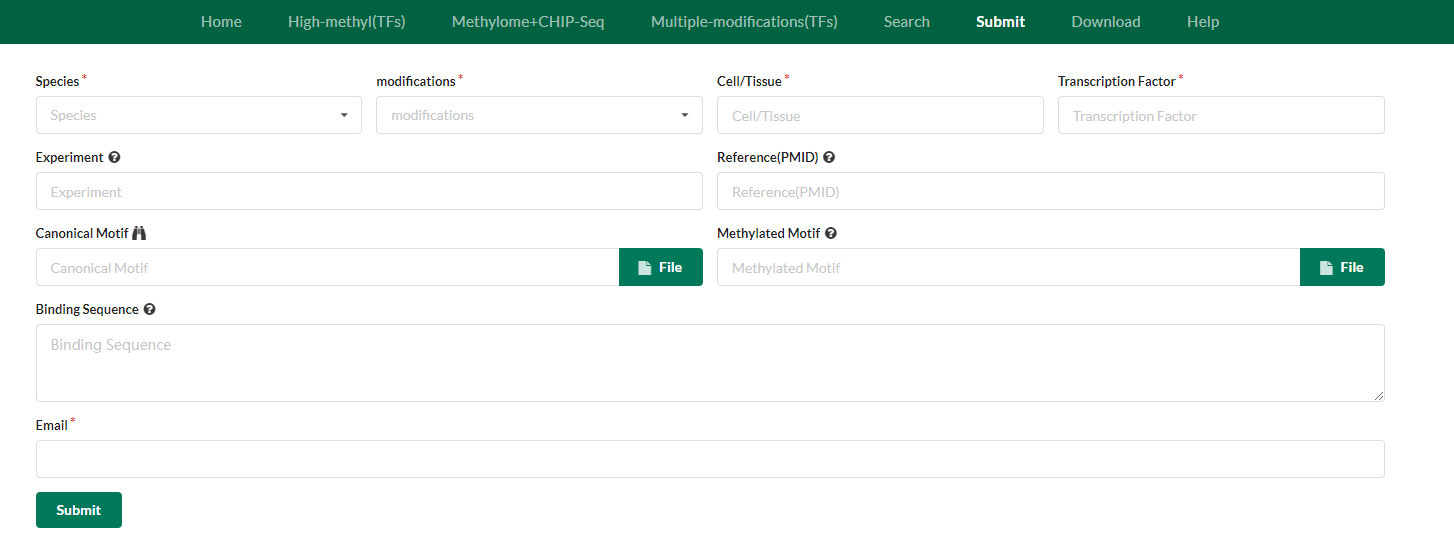
If you project is in vitro, you can type in ‘in vitro’ in the Cell/Tissue box. In the Experiment box, you can type in the symbol of the experimental techniques used in your project. If you have published the research article, provide the PMID please. If you have information about motifs, you can upload the files about the two classes of motifs in any file format. It is best to the PWMs and logos of motifs. After manual curation and computational analysis, your submitting information about methylated DNA-dependent TFs will be uploaded to our database and we will notify you vis email.
If you project is in vitro, you can type in ‘in vitro’ in the Cell/Tissue box. In the Experiment box, you can type in the symbol of the experimental techniques used in your project. If you have published the research article, provide the PMID please. If you have information about motifs, you can upload the files about the two classes of motifs in any file format. It is best to the PWMs and logos of motifs. After manual curation and computational analysis, your submitting information about methylated DNA-dependent TFs will be uploaded to our database and we will notify you vis email.
UCSC Track descriptions
Using the visual UCSC track to show the TFs binding is a great convenience to users.
We have provided a link to facilitate users to browse the TF binding site and DNA methylation
level by adding a track to the UCSC Genome Browser. Here is an example to show the track.
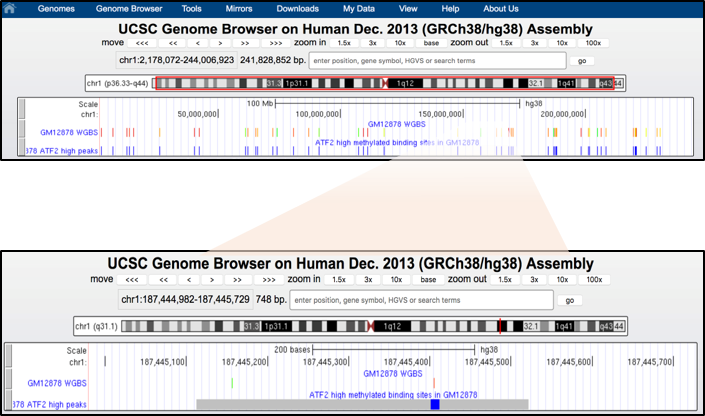
DNA methylation level is represented with an 11-color gradient using the following convention: red=100% of molecules sequenced are methylated, yellow=50% of molecules sequenced are methylated and green= 0% of molecules sequenced are methylated.
DNA methylation level is represented with an 11-color gradient using the following convention: red=100% of molecules sequenced are methylated, yellow=50% of molecules sequenced are methylated and green= 0% of molecules sequenced are methylated.