Tutorial -
Populus Trichocarpa Genome Browser
DESCRIPTION
The Populus Trichocarpa Genome Browser is developed to provide comprehensive functional annotation and visualization of P.trichocarpa genome. The PtrGB integrated over 100 P.trichocarpa genomic data tracks, including reference sequence, gene annotation, GC content, heterozygous loci, repeat regions, regulation elements, comparative genomics data and gene expression pattern in diverse plant organs.
The Populus Trichocarpa Genome Browser is best accessed using Google Chrome, and works smoothly as well with other web-browsers, including Mozilla Firefox, Safari, Microsoft Internet Explorer (Version 10 or later), Opera, etc. HTML5 Canvas is used as the graphic engine to plot the visual elements, thus some earlier versions of web-browsers that do not support HTML5, such as IE6-9, are not compatible with the PtrGB.
The Populus Trichocarpa Genome Browser can also be easily deployed on a user's server. A few basic supporting data/tool is required for the PtrGB local installation, such as reference sequence, cytoBand, Ptrv4.0 Genes, and NCBI Blast+ program. Tomcat8+ and JAVA is also needed for PtrGB running. Detailed instructions can be found in the package.
CONTENTS
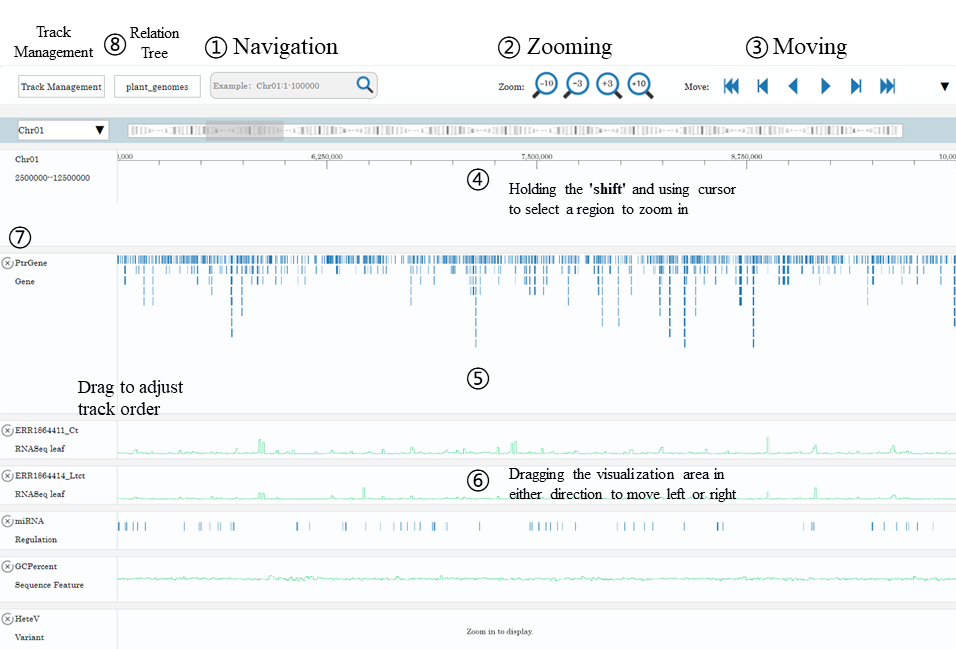
Basic operations
Visualization Elements Of The Four Types Of Tracks
Track Management
Comparative Genomics
Blast Sequence Search Engine
Contact
BASIC OPERATIONS
1. Navigation • Navigation by chromosome coordinates Chr01:1-2345678 √
chr01:1-10000 x
chr01 1 2345678 x
1:1-2345678 x
Chr1:1-10000 x• Navigation by gene symbol Auto-complete √
Case-insensitive √2. Zooming
: Zoom out to 3 or 10 times range of current browsing region.
: Zoom in to 1/3 or 1/10 range of current browsing region.
3. and
: Region movement by 95% of the current span.
and
: Region movement by 50% of the current span.
and
: Region movement by 5% of the current span.
4. Holding the 'shift' and using cursor to select a region to zoom in* 5. Holding the 'z' key and scrolling the mouse wheel to zoom out/in* *These operations may be invalid if the hotkey is occupied by browser plugins or other programs. 6. Dragging the visualization area in either direction to move left or right within the current zoom level 7. Clicking 'x' button to hide a track. 8. The tracks can be reordered by drag-and-drop operation of the meta-information region.

VISUALIZATION ELEMENTS OF THE FOUR TYPES OF TRACKS
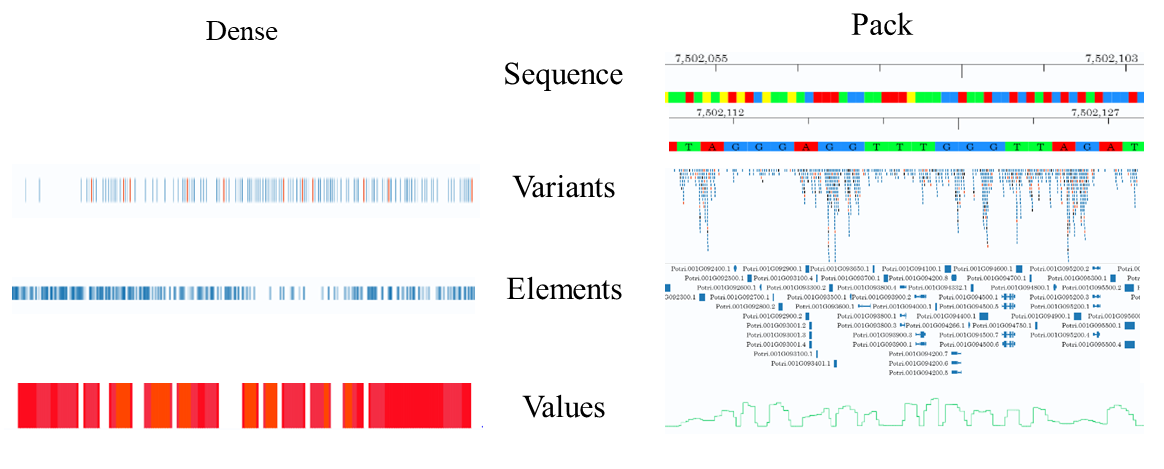
Genomic data in different formats are displayed by four track types in PtrGB, including sequence, variants, elements, and values. Sequence type has one display mode. Other four types have two display modes: dense and pack.
1.Sequence
In sequence track, the genome data is a sequence of bases, which are denoted by different colours and letters. The P.trichocarpa reference genome is displayed as a sequence track with coordinate ruler. When the browsing regions is too large to show individual nucleotides, the sequence region will be hided, only coordinate ruler left.2.Variants
In variants tracks, the variants are denoted by short vertical lines (or bands if the variants cover large regions). Different types of variants are denoted by different colours: SNVs are black, insertions are blue, deletions are orange. Users can then get an overall view of browsing region. Variants tracks in dense mode are also displayed in this colour scheme. The heterozygous loci of P.trichocarpa is a typical variants track.3.Elements
Elements tracks describe the genomic features in discrete regions. The attributes of the features, such as exon, intron, coding region, direction, etc., are denoted by different shapes. Tracks such as gene annotation, miRNA annotation and repeat masks are displayed as elements tracks.4.Values
Values tracks describe features of genomic position/region, including conservation, gene expression level, GC content, etc. Heatmap and curves are adopted to display the values of these features.When elements and variants track are displayed in the pack mode, user can check detail information of each displayed unit by clicking on them.
Track Management
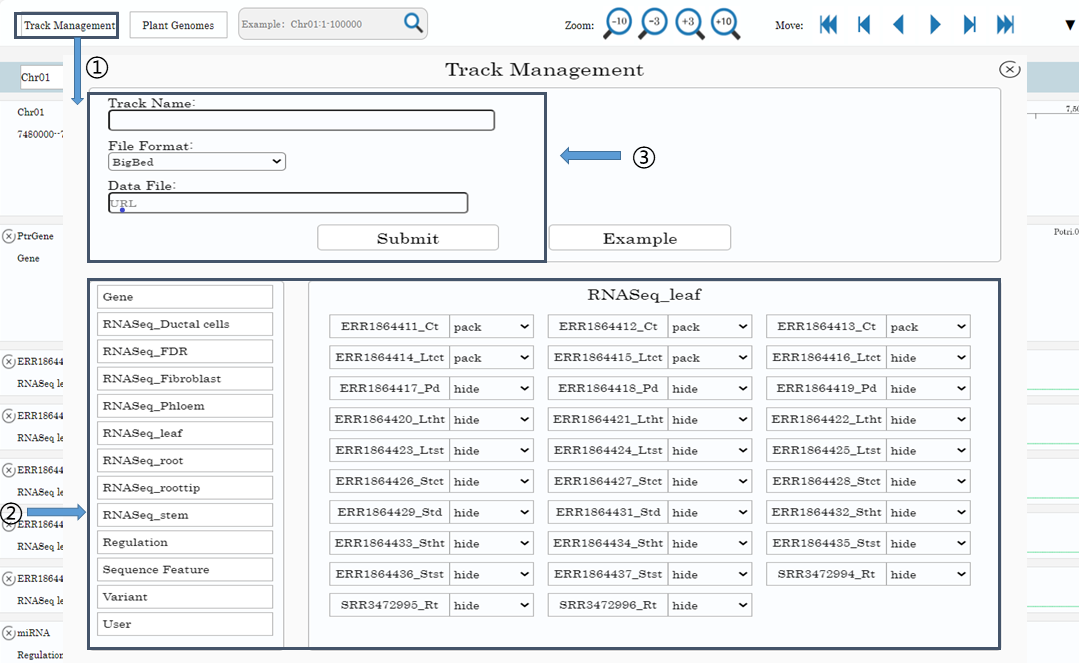
There are over 100 built-in tracks in PtrGB. The tracks are grouped into 12 groups, including Gene, Sequence Feature, Variants, Regulation and RNA-seq gene expression data of 8 different plant organs. They can be managed in the ‘Track management’ window. User can click the ‘Track management’ button on the menu bar to open the ‘Track management’ window(1).
In the ‘Track management’ window, there are 3 panels: left panel, right panel and top panel. Group buttons are in the left panel, clicking on the buttons, tracks in the group are displayed in right panel. Tracks can be displayed, hided and mode-changed by drop-down menu(2).
Users can also add/remove custom tracks of their own data in the top panel(3), as long as the data URL is public accessible on the internet. The PtrGB support BigBed, BigWig, and Bgzip/Tabix compressed/indexed VCF format data for custom tracks. The submitted custom tracks can be found in the ‘User’ group. Custom tracks can only be accessed and viewed by the owner, and the PtrGB will NOT record any information of user data.
COMPARATIVE GENOMICS
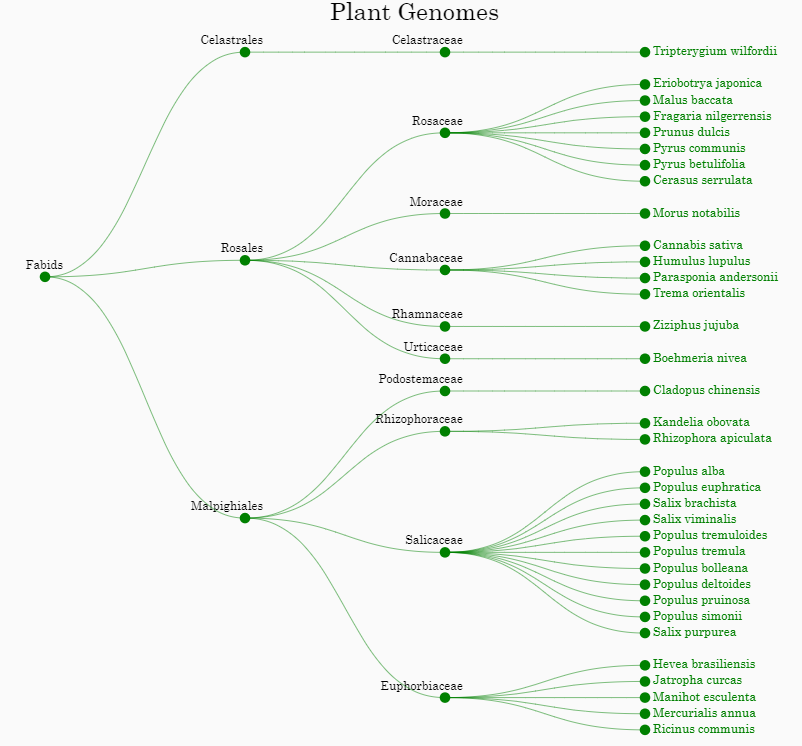
The PtrGB integrated comparative genomics data between P.trichocarpa and 34 other plant genomes, including 11 Salicaceae species close to P.trichocarpa, 8 other Malpighiales, 14 Rosales and 1 Celastrales.
• User can click the ‘Plant genomes’ button on the menu bar to open the ‘Plant genomes’ window. A phylogenetic tree of these species is displayed in the ‘Plant genomes’ window. By clicking on a plant name, user can add the comparative genomics data between P.trichocarpa and the corresponding species to the genome browser.
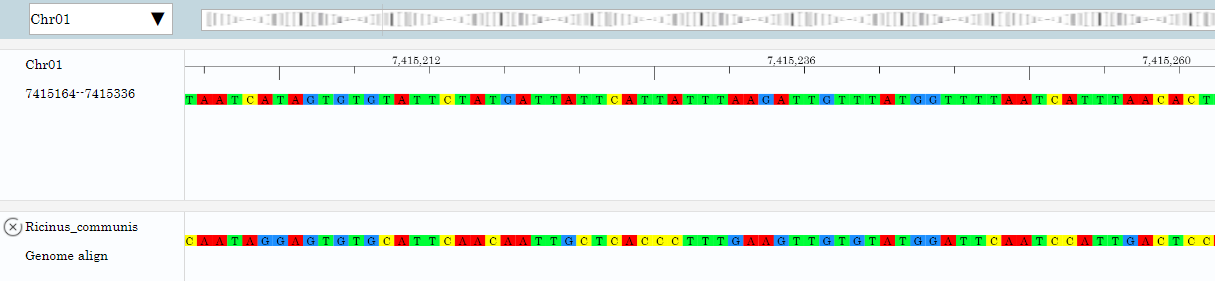
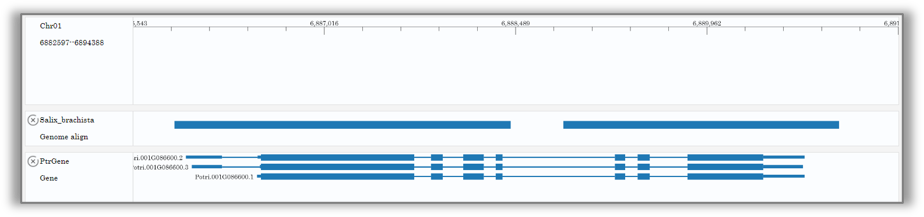
• The comparative genomics data are displayed as sequence tracks when the browsing region is available to show individual nucleotides. When the individual nucleotides are not able to be distinguished, the data will be displayed as element tracks.
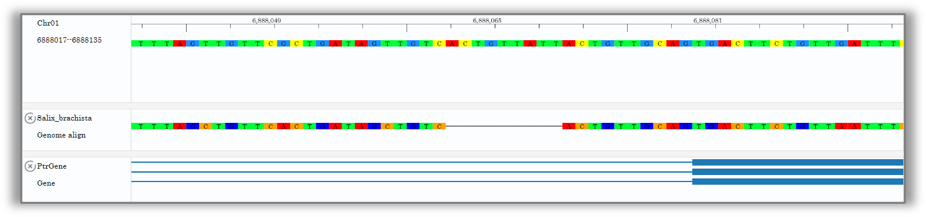
1.Large scale:Multi-species homology region location
2.Small scale:Multi-species homologous sequence visualization
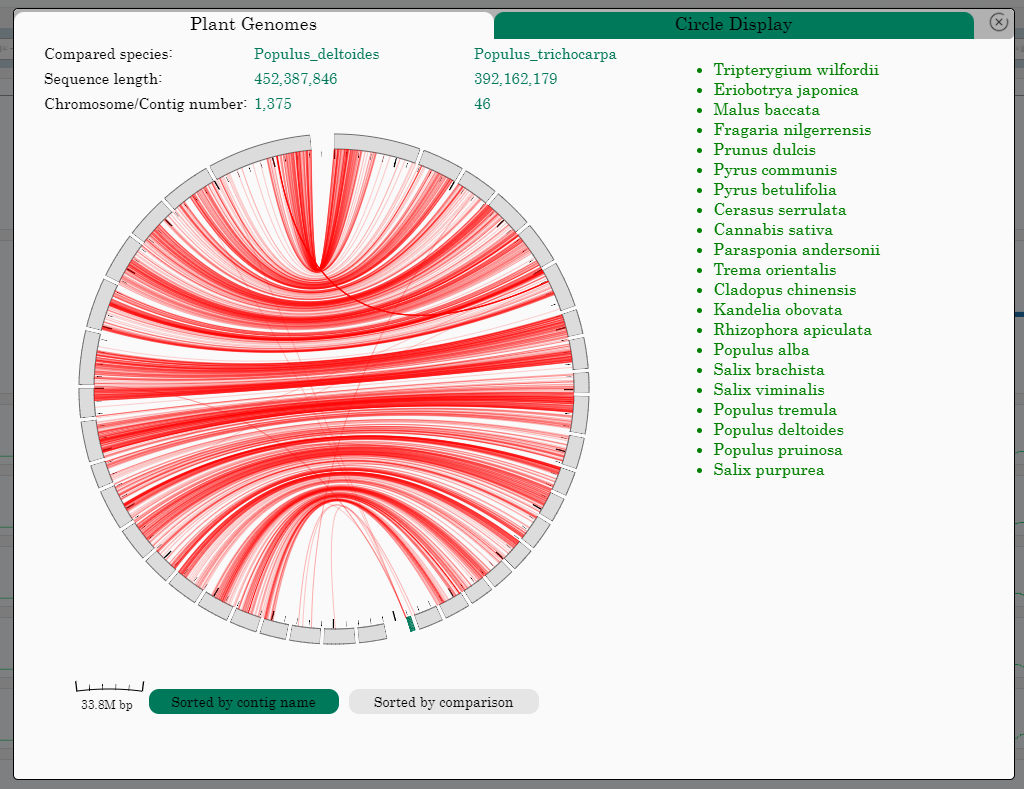
3.Comparative Genomics Circle Display
The PtrGB integrated comparative genomics by circle display between P.trichocarpa and 21 other plant genomes. On the right side of the Circle is P.trichocarpa, and on the left is comparative species. Two comparison modes are provided: "Sorted by contig name" and "Sorted by comparison". Some general information is provided at the top of the circle chart.
• User can click the ‘Circle Display’ button on the ‘Plant genomes’ window to open the 'Circle Display' window. By clicking on a plant name, user can compare the genomics data between P.trichocarpa and the corresponding species to the circle display.
• When the comparative genomics data are displayed as circle. On the right of the circle is P.trichocarpa, and on the left is the selected species.
• The scale in the lower left corner represents the base number of a scale in the current circle display image.
• User can click the ‘Sorted by contig name’ button and the 'Sorted by comparison' on the 'Circle Display' window to select and display two different comparison methods.
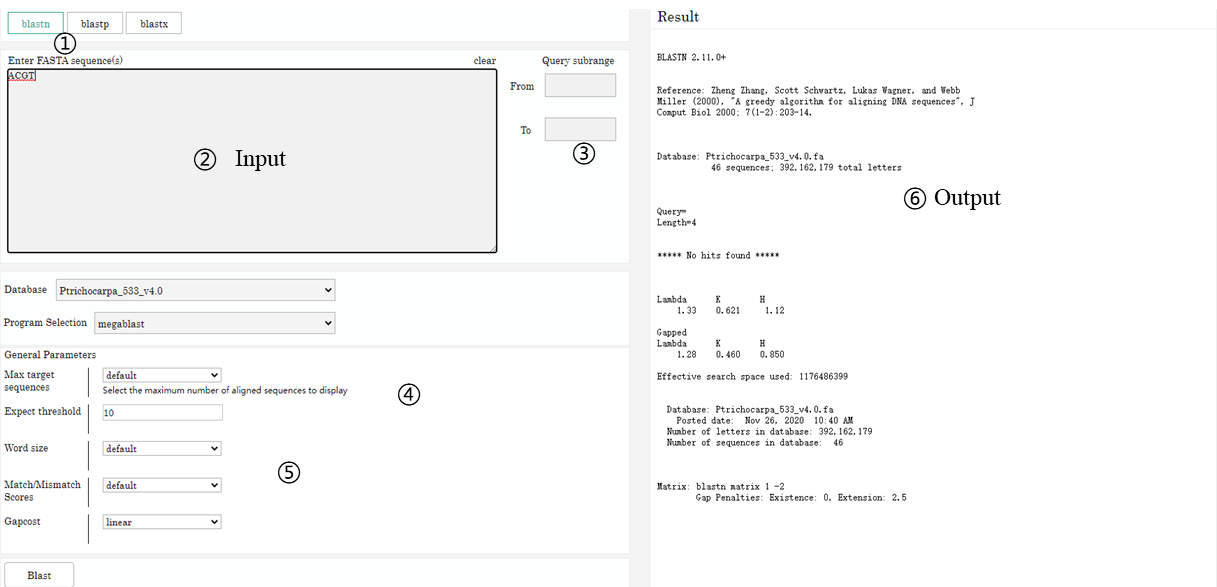
BLAST Sequence Search Engine
NCBI Blast+ is deployed in the system. User can search nucleotide sequence in P.trichocarpa genome, Salicaceae species, and all plant genomes that integrated in the PtrGB. The searching operation may take a few minutes depends on the input sequence feature.
Main function introduction
1. BLAST Search Mode 2. Input Sequence 3. Search sequence subregion 4. Select Sequence Database 5. BLAST Parameter Settings 6. Output result
CONTACT
Please do not hesitate to address comments/questions/suggestions regarding this webpage to: pgbrowser@gmail.com..
| Populus Trichocarpa GenomeBrowser-1.0 | Populus Trichocarpa Genome Browser | 10 October 2020 |