The current version of PlantCADB allows users to:
(1) Query the chromatin accessibility area of 37 plant species, and obtain the detailed data source and its description.(2) Obtain the distribution of sample chromatin accessibility regions on each chromosome, TSS Enrichment, and detailed genome annotations, including the distribution of accessibility regions in 3'UTR, 5'UTR, promoter, exon, intron, distal Intergenic, etc.
(3) Aquire the relevant genes, motif enrichment and transcription binding sites of each chromatin accessibility region annotations of each sample.
(4) Download the results of chromatin accessibility regions, associated genes, and footprint analysis result.
(5) Submit newly published information of chromatin accessibility datasets to enrich our database.
Home
page Users can clearly understand the function of the database and detailed statistics. In current version of PlantCADB reported a total of 18,065,954 accessible chromatin regions from more than 600 samples. We manually collected data related to chromatin accessibility of four types of ATAC-seq(302), DNase-seq(317), FAIRE-seq(15) and MNase-seq(4) from GEO and SRA databases, a total of 37 plant species, which committed to integrating and analyzing chromatin accessibility data of all available on plant species.Data browse
page Users can select multiple filter criteria to query the data they are interested in, and each sample is followed by a brief description of the data.To view the chromatin accessibility area of the specified sample, the user simply clicks “Sample ID” to view it.We have named different data types differently, ATAC-seq as ”Sample_00”, DNase-seq as ”Sample_01”, FAIRE-seq as ”Sample_02” and MNase-seq as ”Sample_03”.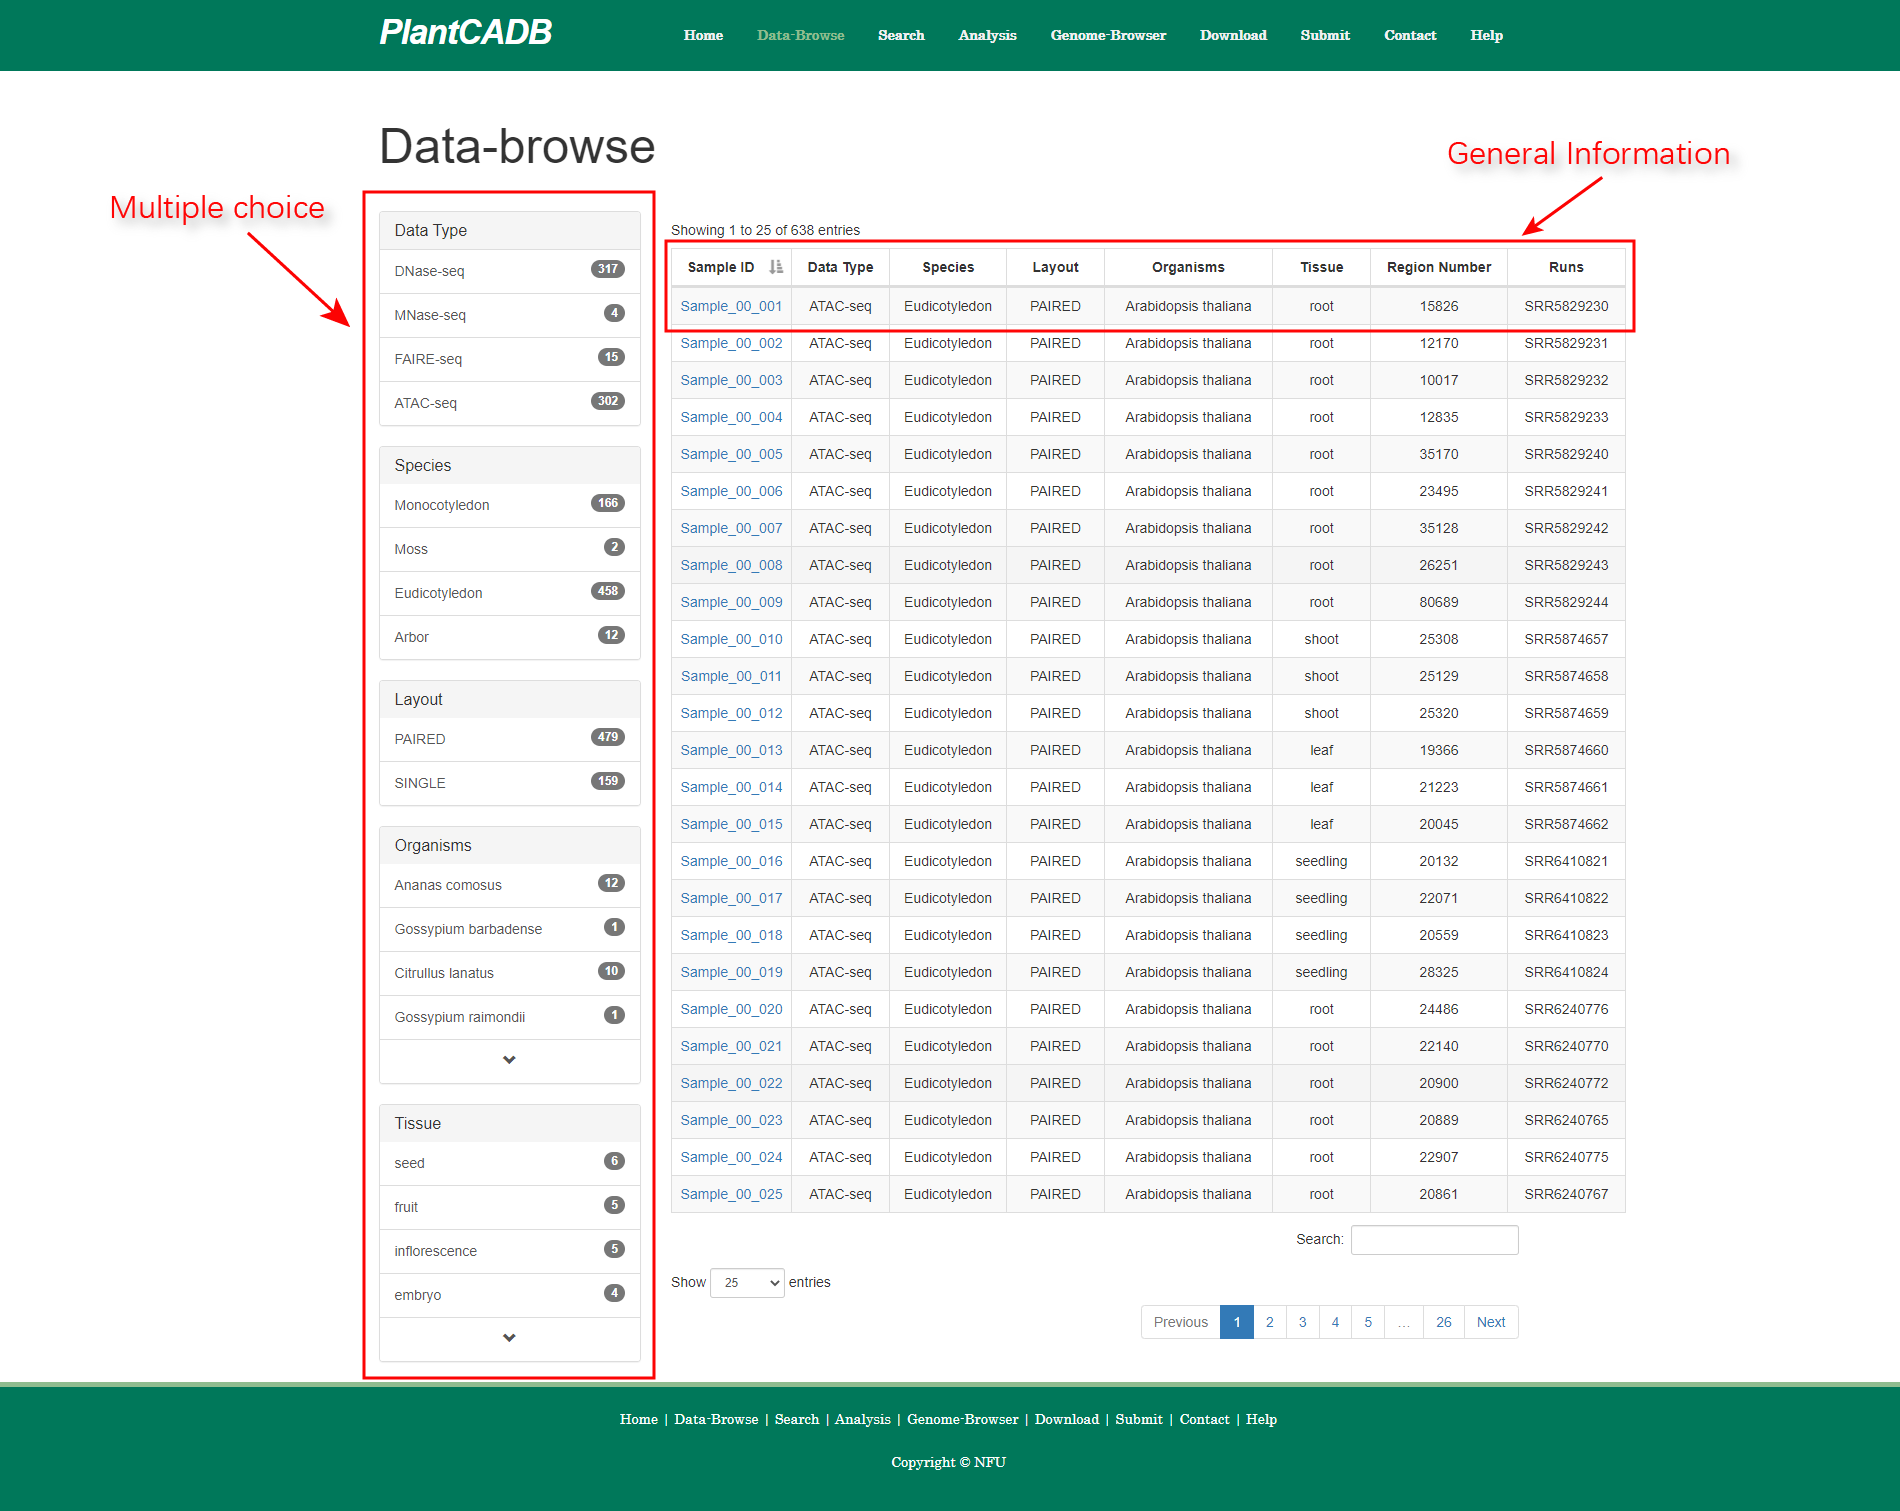
Sample detailed
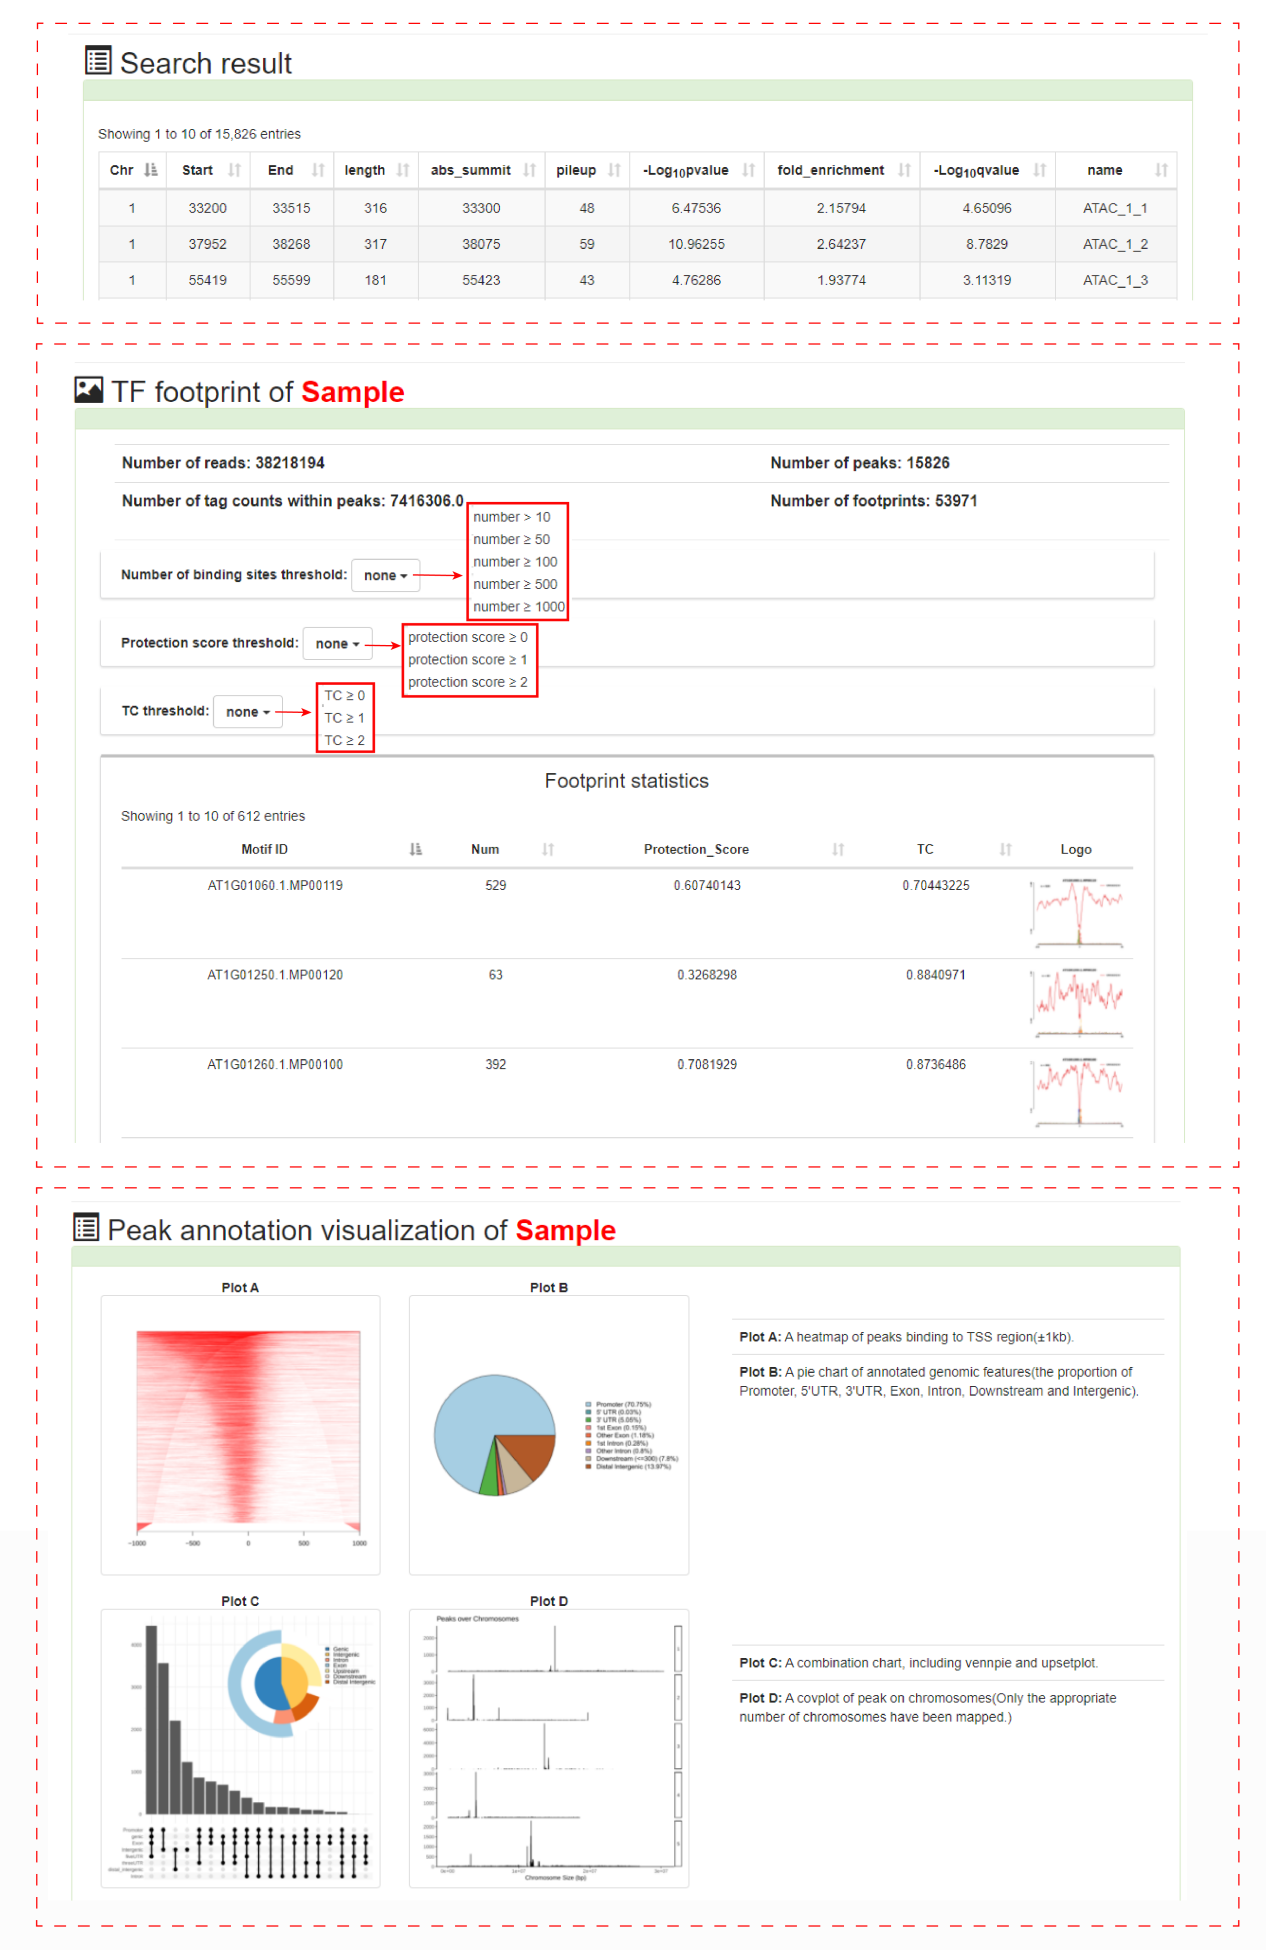
page Users can obtain detailed information about samples of interest, including sample overview, chromosome number pie chart of chromatin accessibility regions distribution, search result table, TF footprint annotation and peak annotation visualization. PlantCADB used HINT footprint analysis based on hidden markov model (HMM) to obtain the analysis result of TF footprint. Because ATAC-seq data and DNase-seq data have different degrees of bias during the experiment, different protocols are used for different types of data, ATAC-seq data is based on ATAC-seq model, DNase-seq data is based on DNase-seq model. The result files we got include TFs with the Tag Count (TC), protection score, number of binding sites and footprint logo were identified for each sample. PlantCADB uses CHIPseeker to realize the visualization function of peak mark. We support displaying chromatin accessibility areas in different ways, including profiles of peaks binding to TSS region, peaks coverage over chromosomes and Peak distribution map on chromosomes.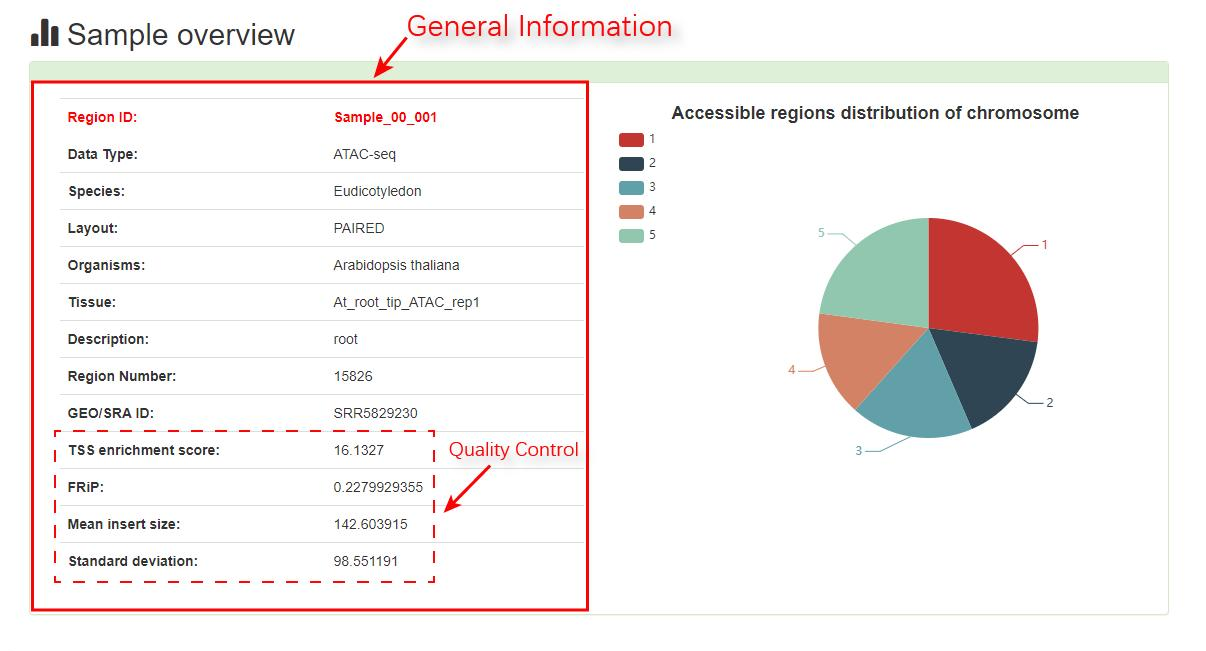
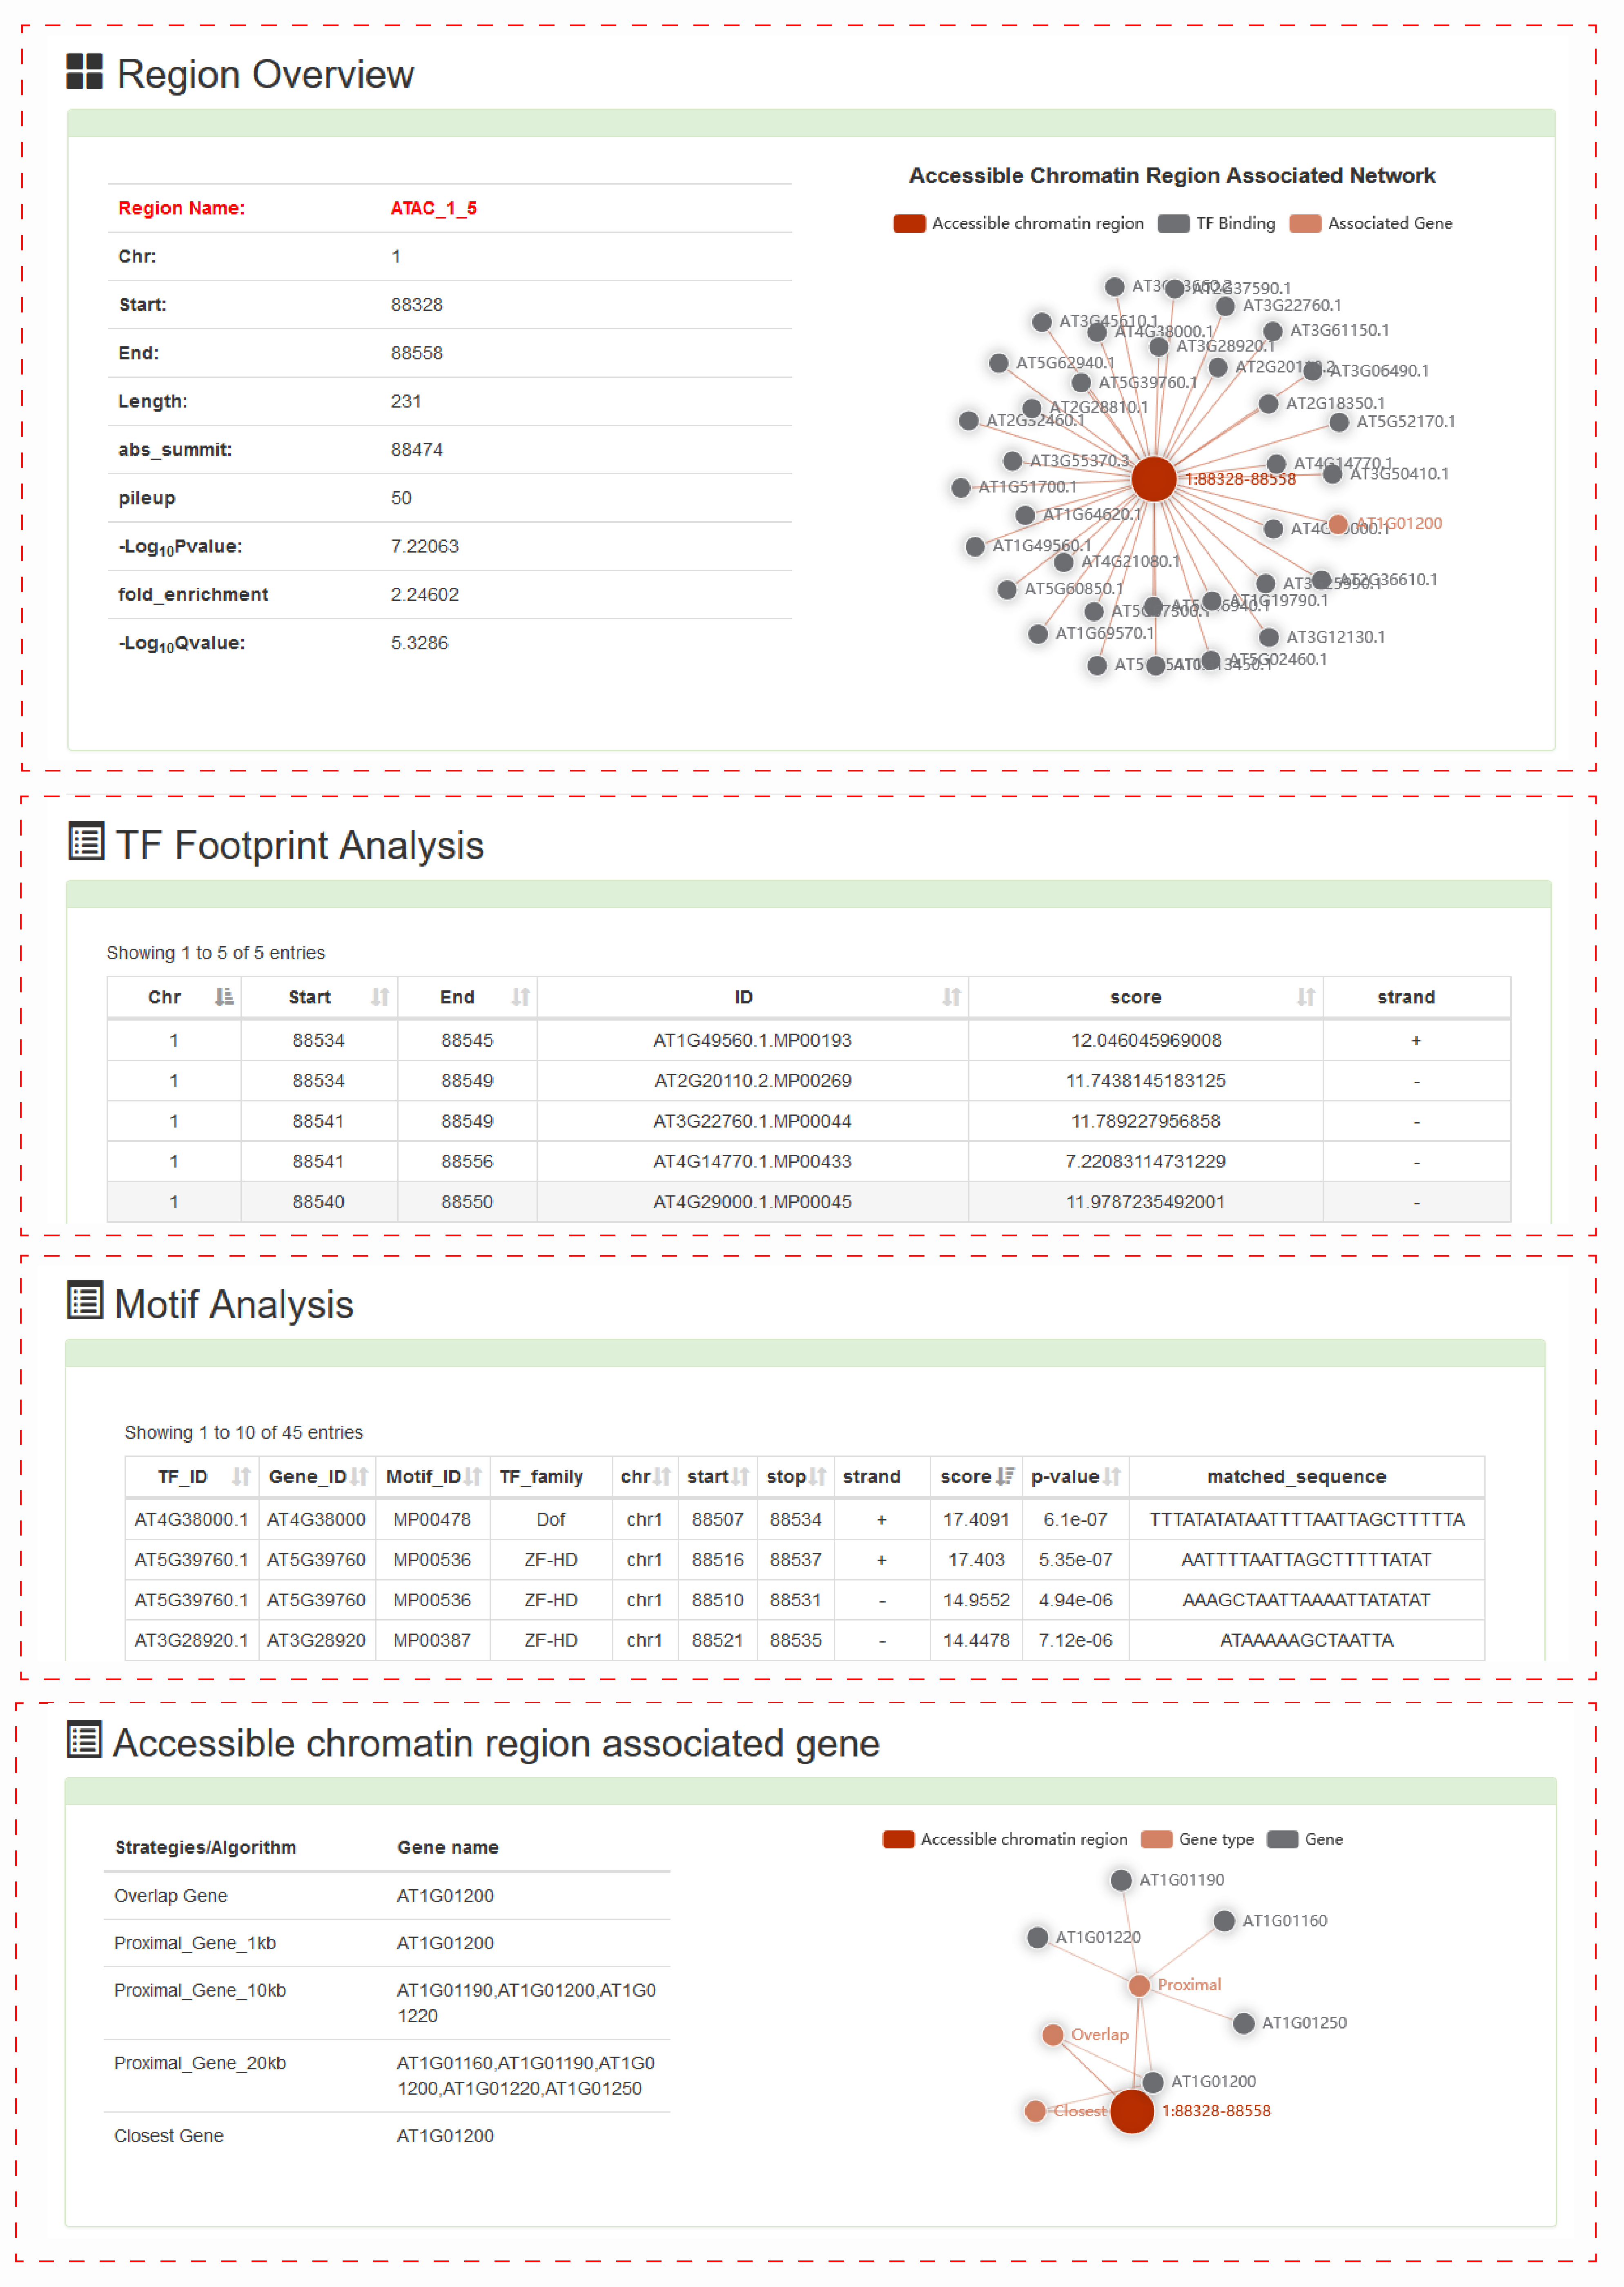
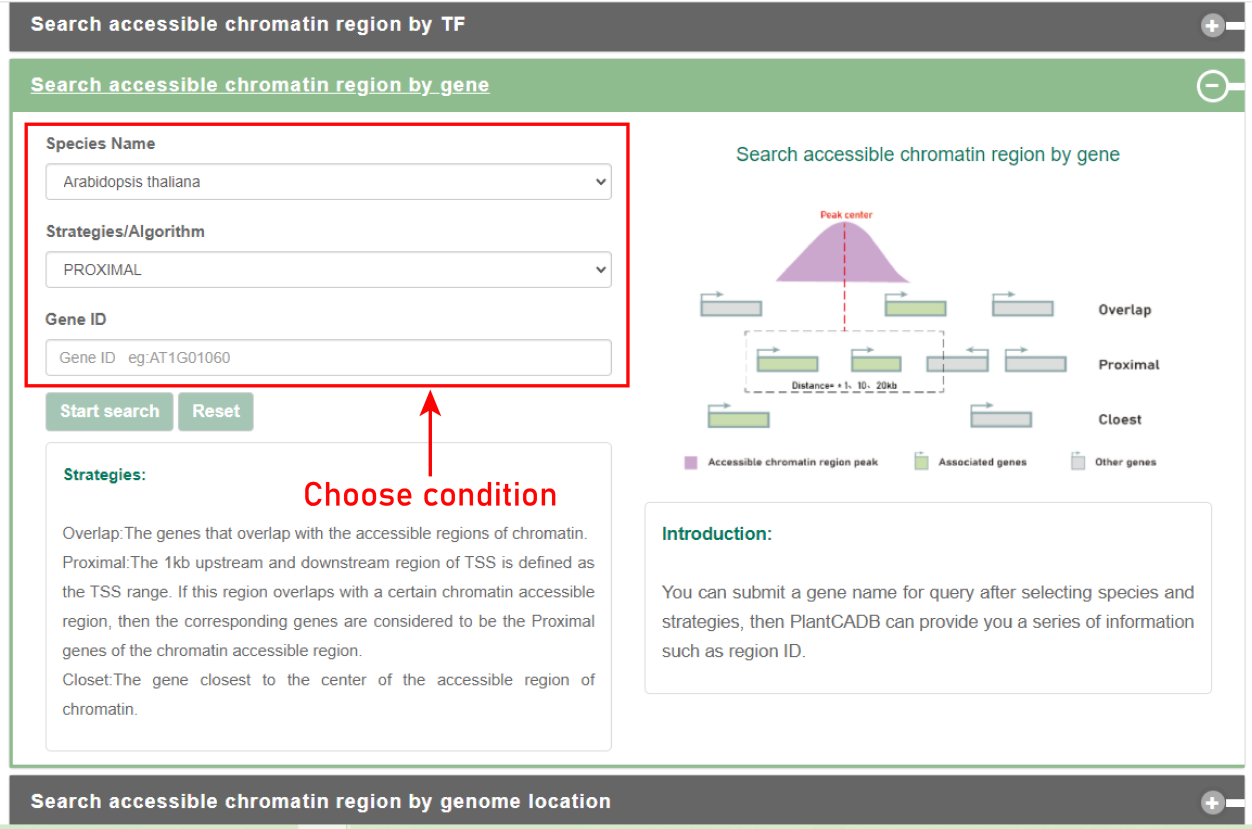
For detail about the accessible chromatin region, we provide more detailed TF footprint corresponding scores, the results of motif scan and associated genes. Motif Scanning includes location information, sequence scores, and matched sequences. We provide five analysis results for related genes, including overlap genes, proximal genes within ± 1kb, proximal genes within ± 10kb, proximal genes within ± 20kb and closet gene.
Users can query the data in which they are interested in three ways, through TF, gene or a region.
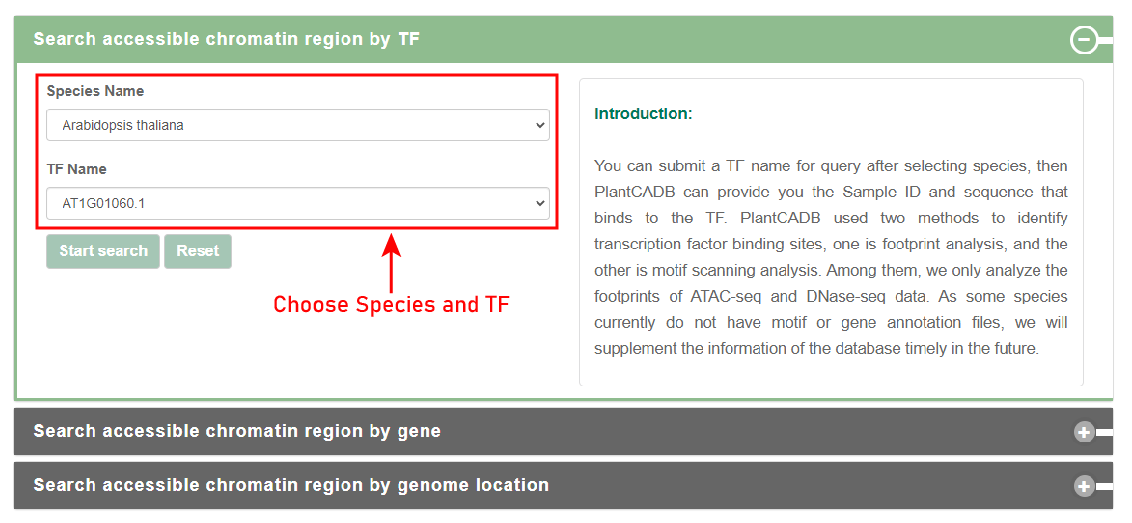
Search by TF:
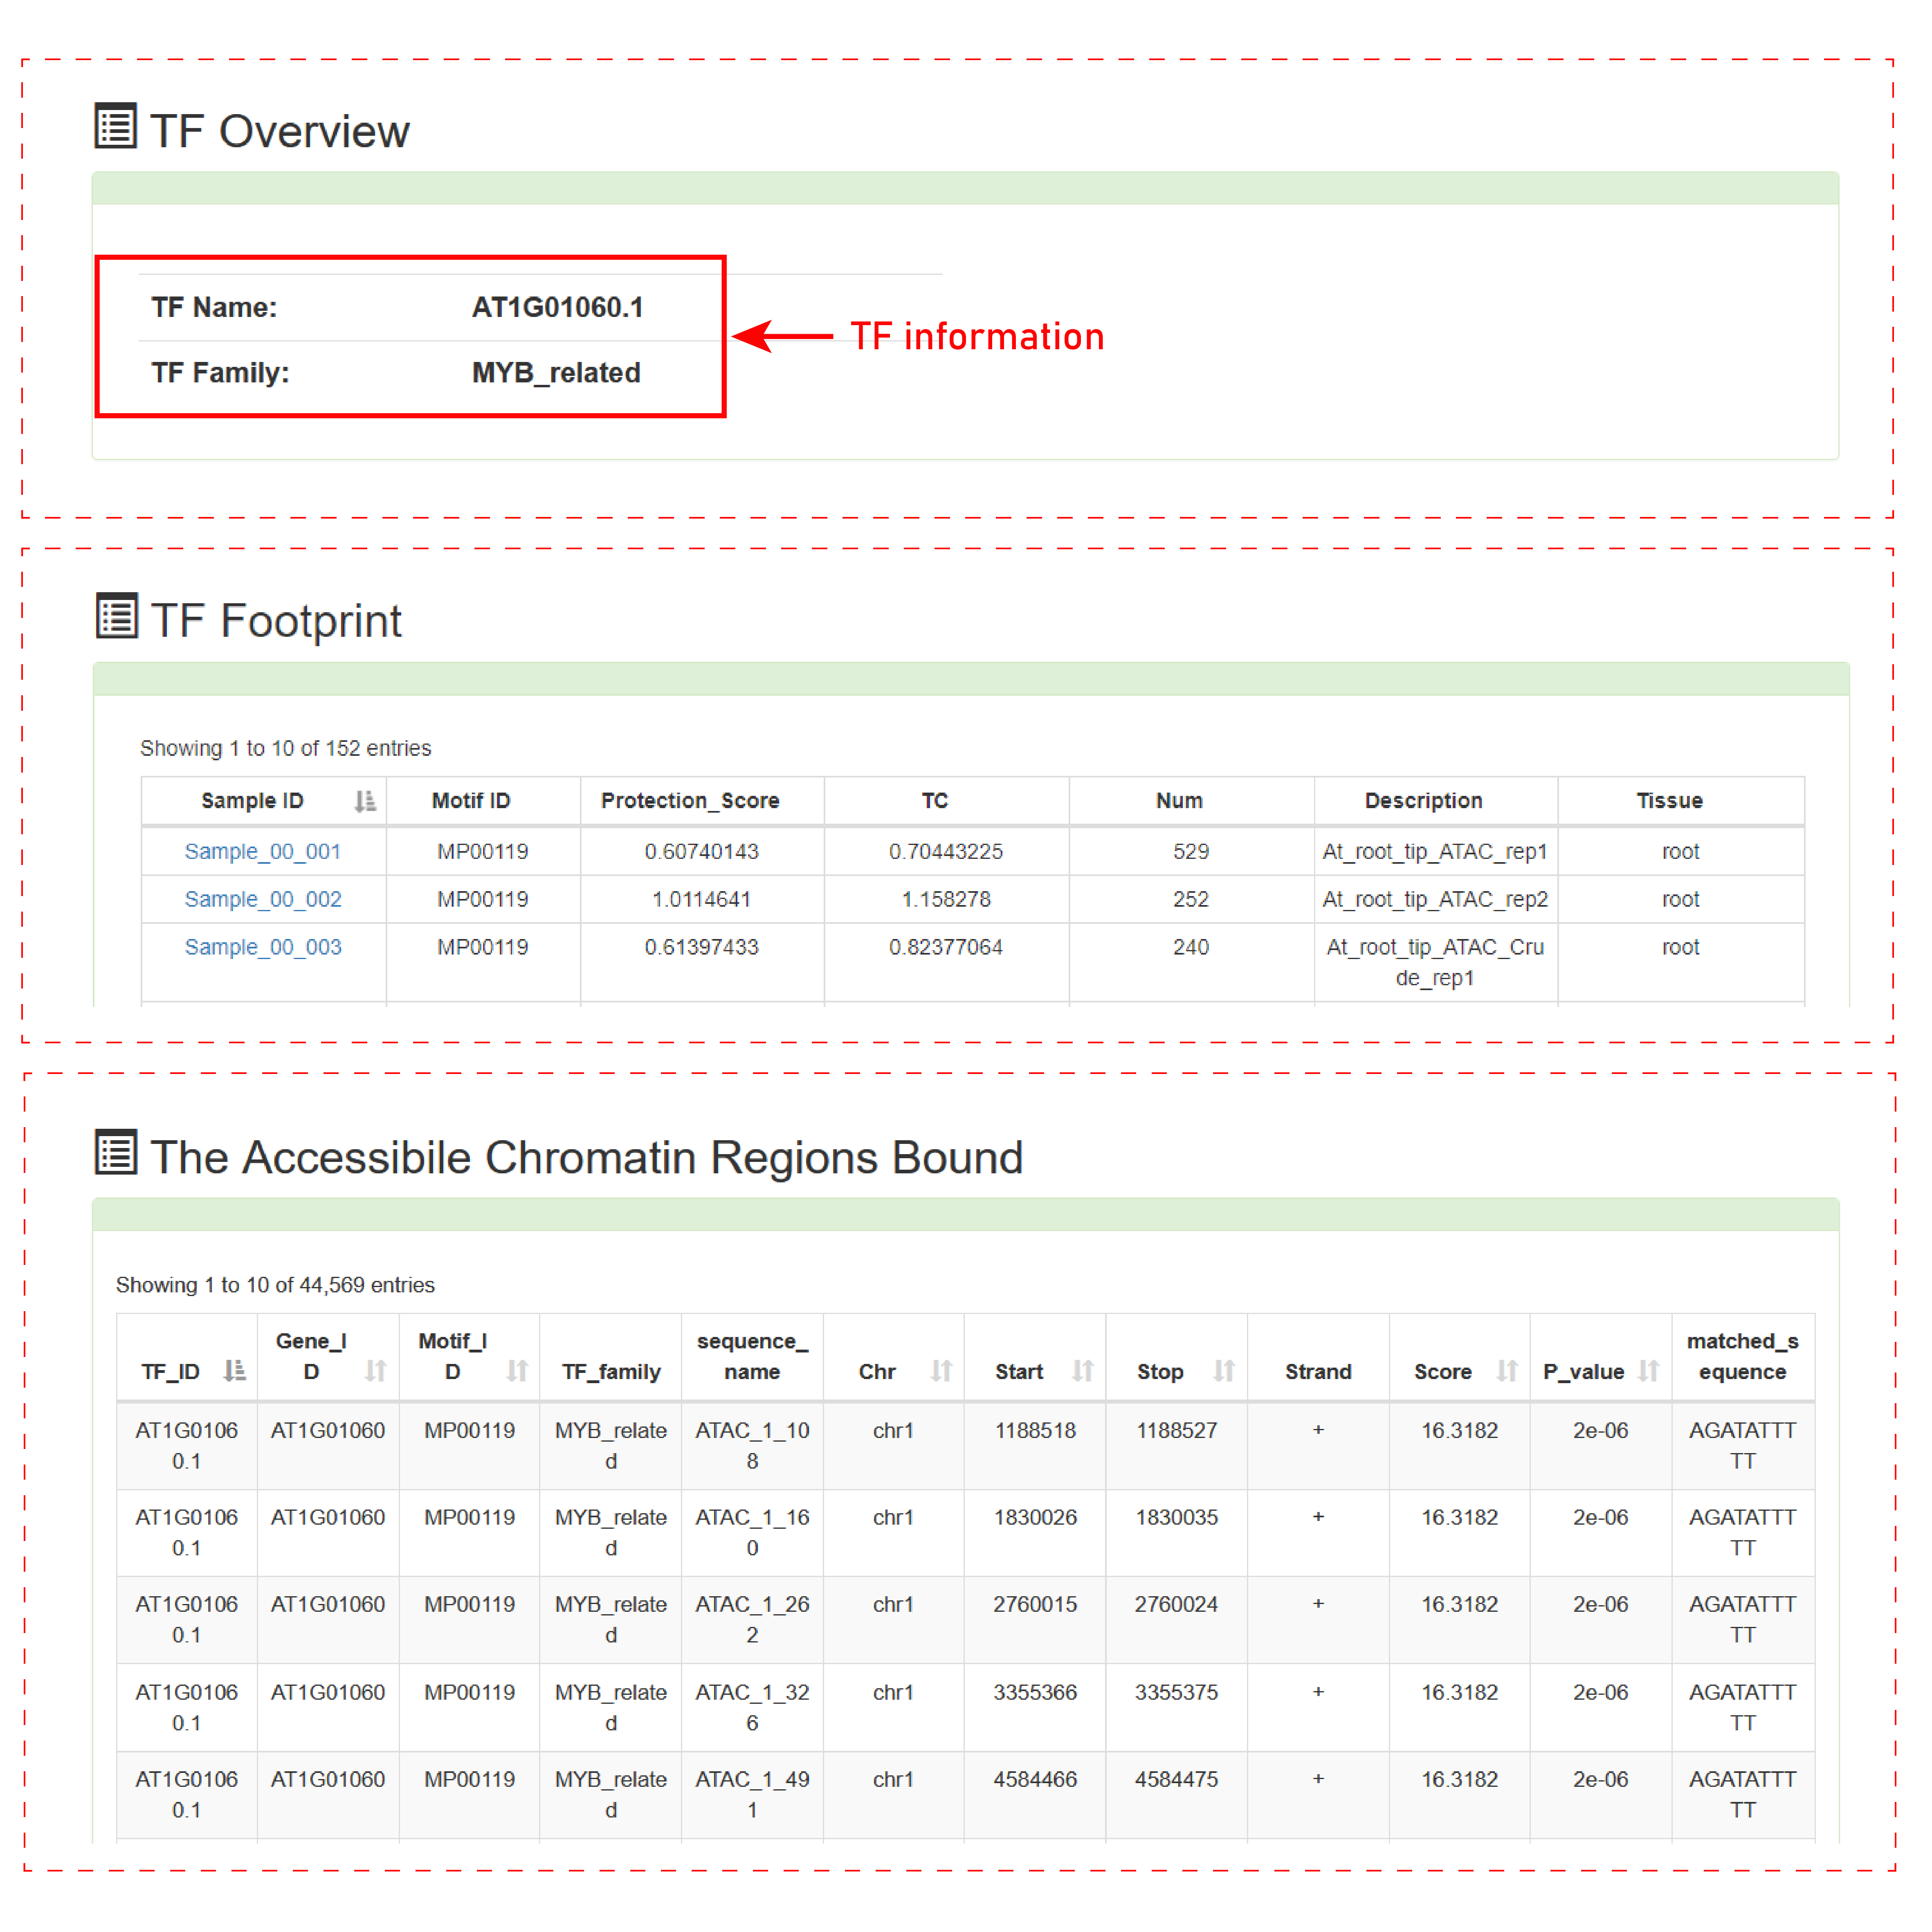
Users can submit a TF name for query after selecting species, then PlantCADB can provide you the Sample ID and sequence that binds to the TF. PlantCADB used two methods to identify transcription factor binding sites, one is footprint analysis, and the other is motif scanning analysis. Among them, we only analyze the footprints of ATAC-seq and DNase-seq data. As some species currently do not have motif or gene annotation files, we will supplement the information of the database timely in the future.
Search by gene:
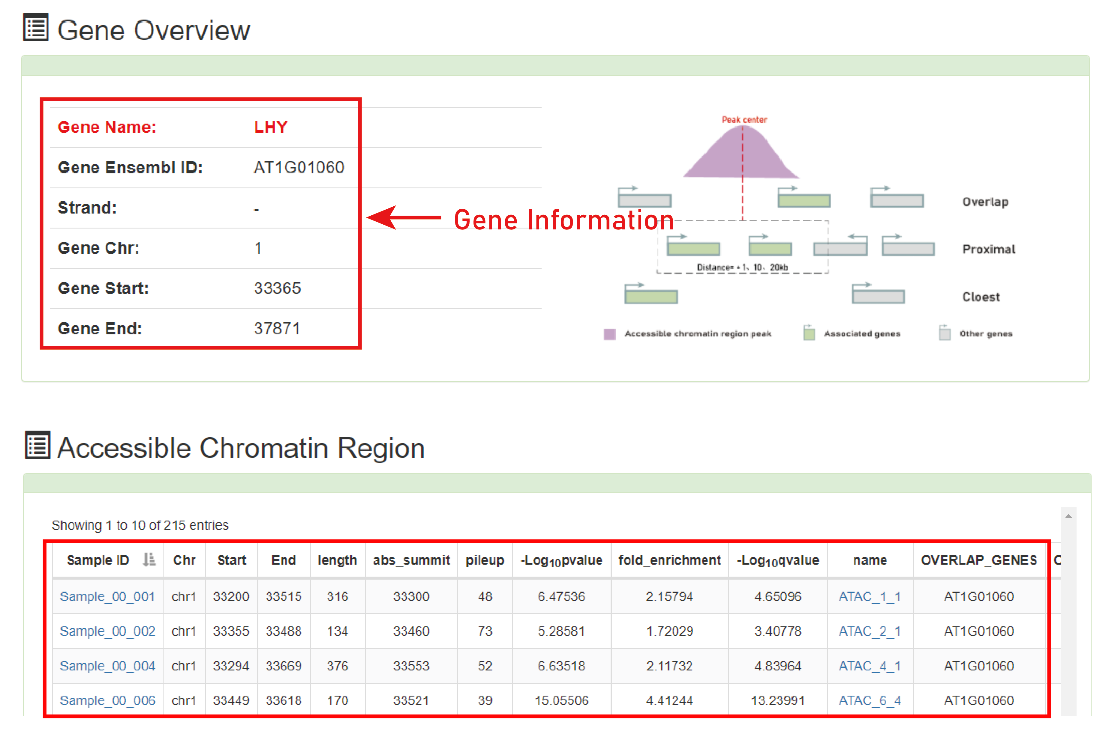
Users can submit a gene name for query after selecting species and strategies, then PlantCADB can provide you a series of information such as region ID.
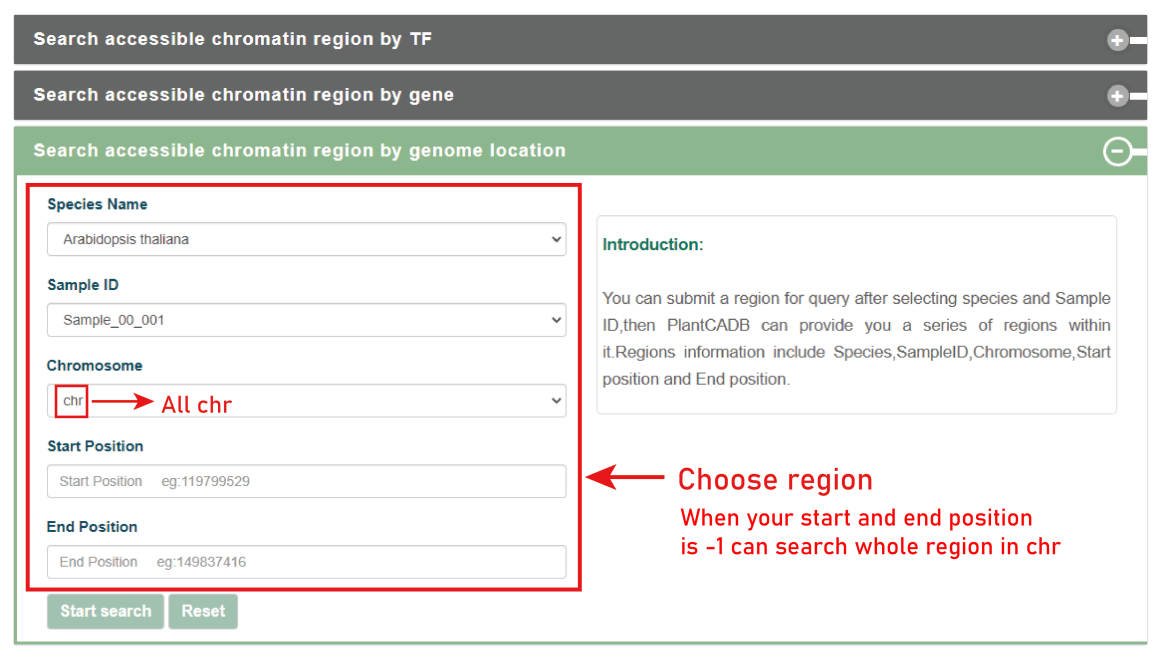
Search by genome region:
Users can submit a region for query after selecting species and Sample ID, then PlantCADB can provide you a series of regions within it. Regions information include species, sample_ID, chromosome, start position and end position.
PlantCADB provides two tools for data analysis.
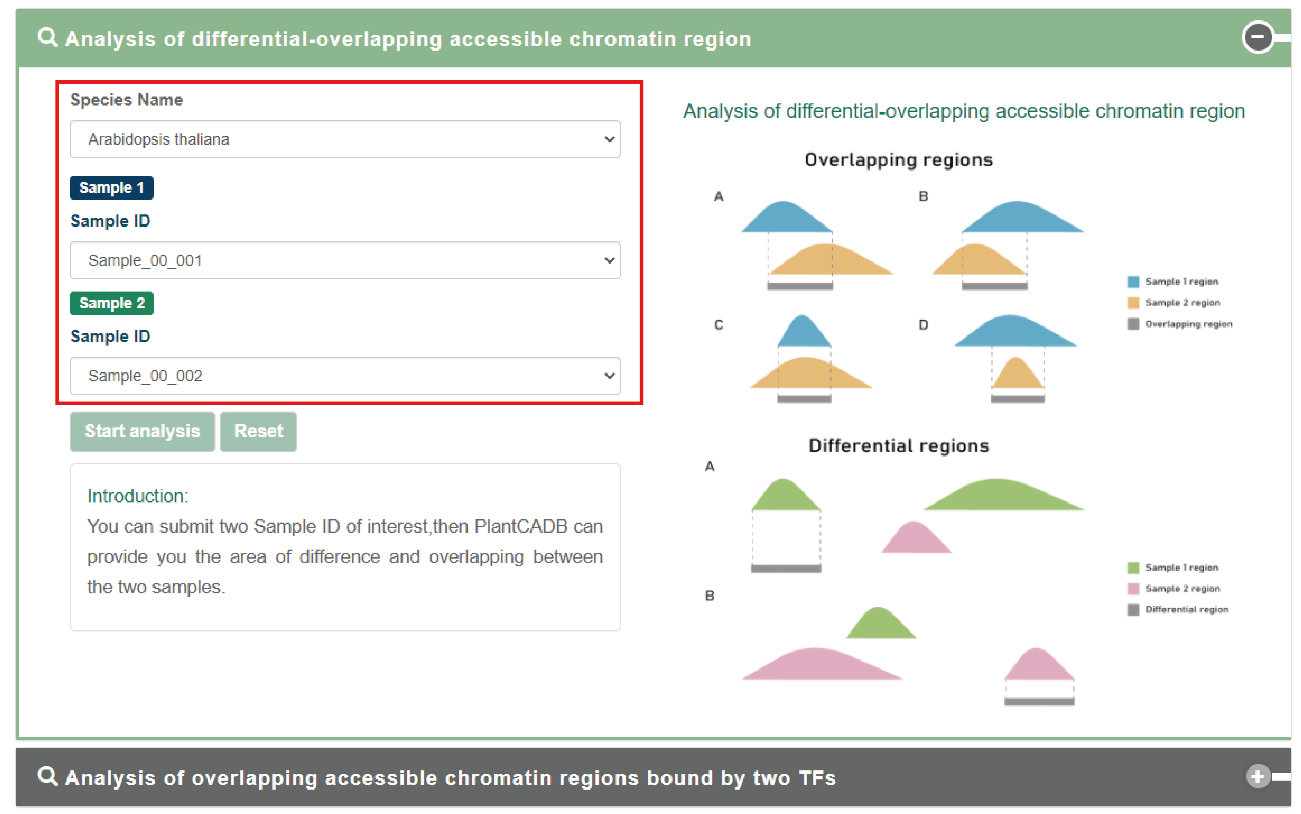
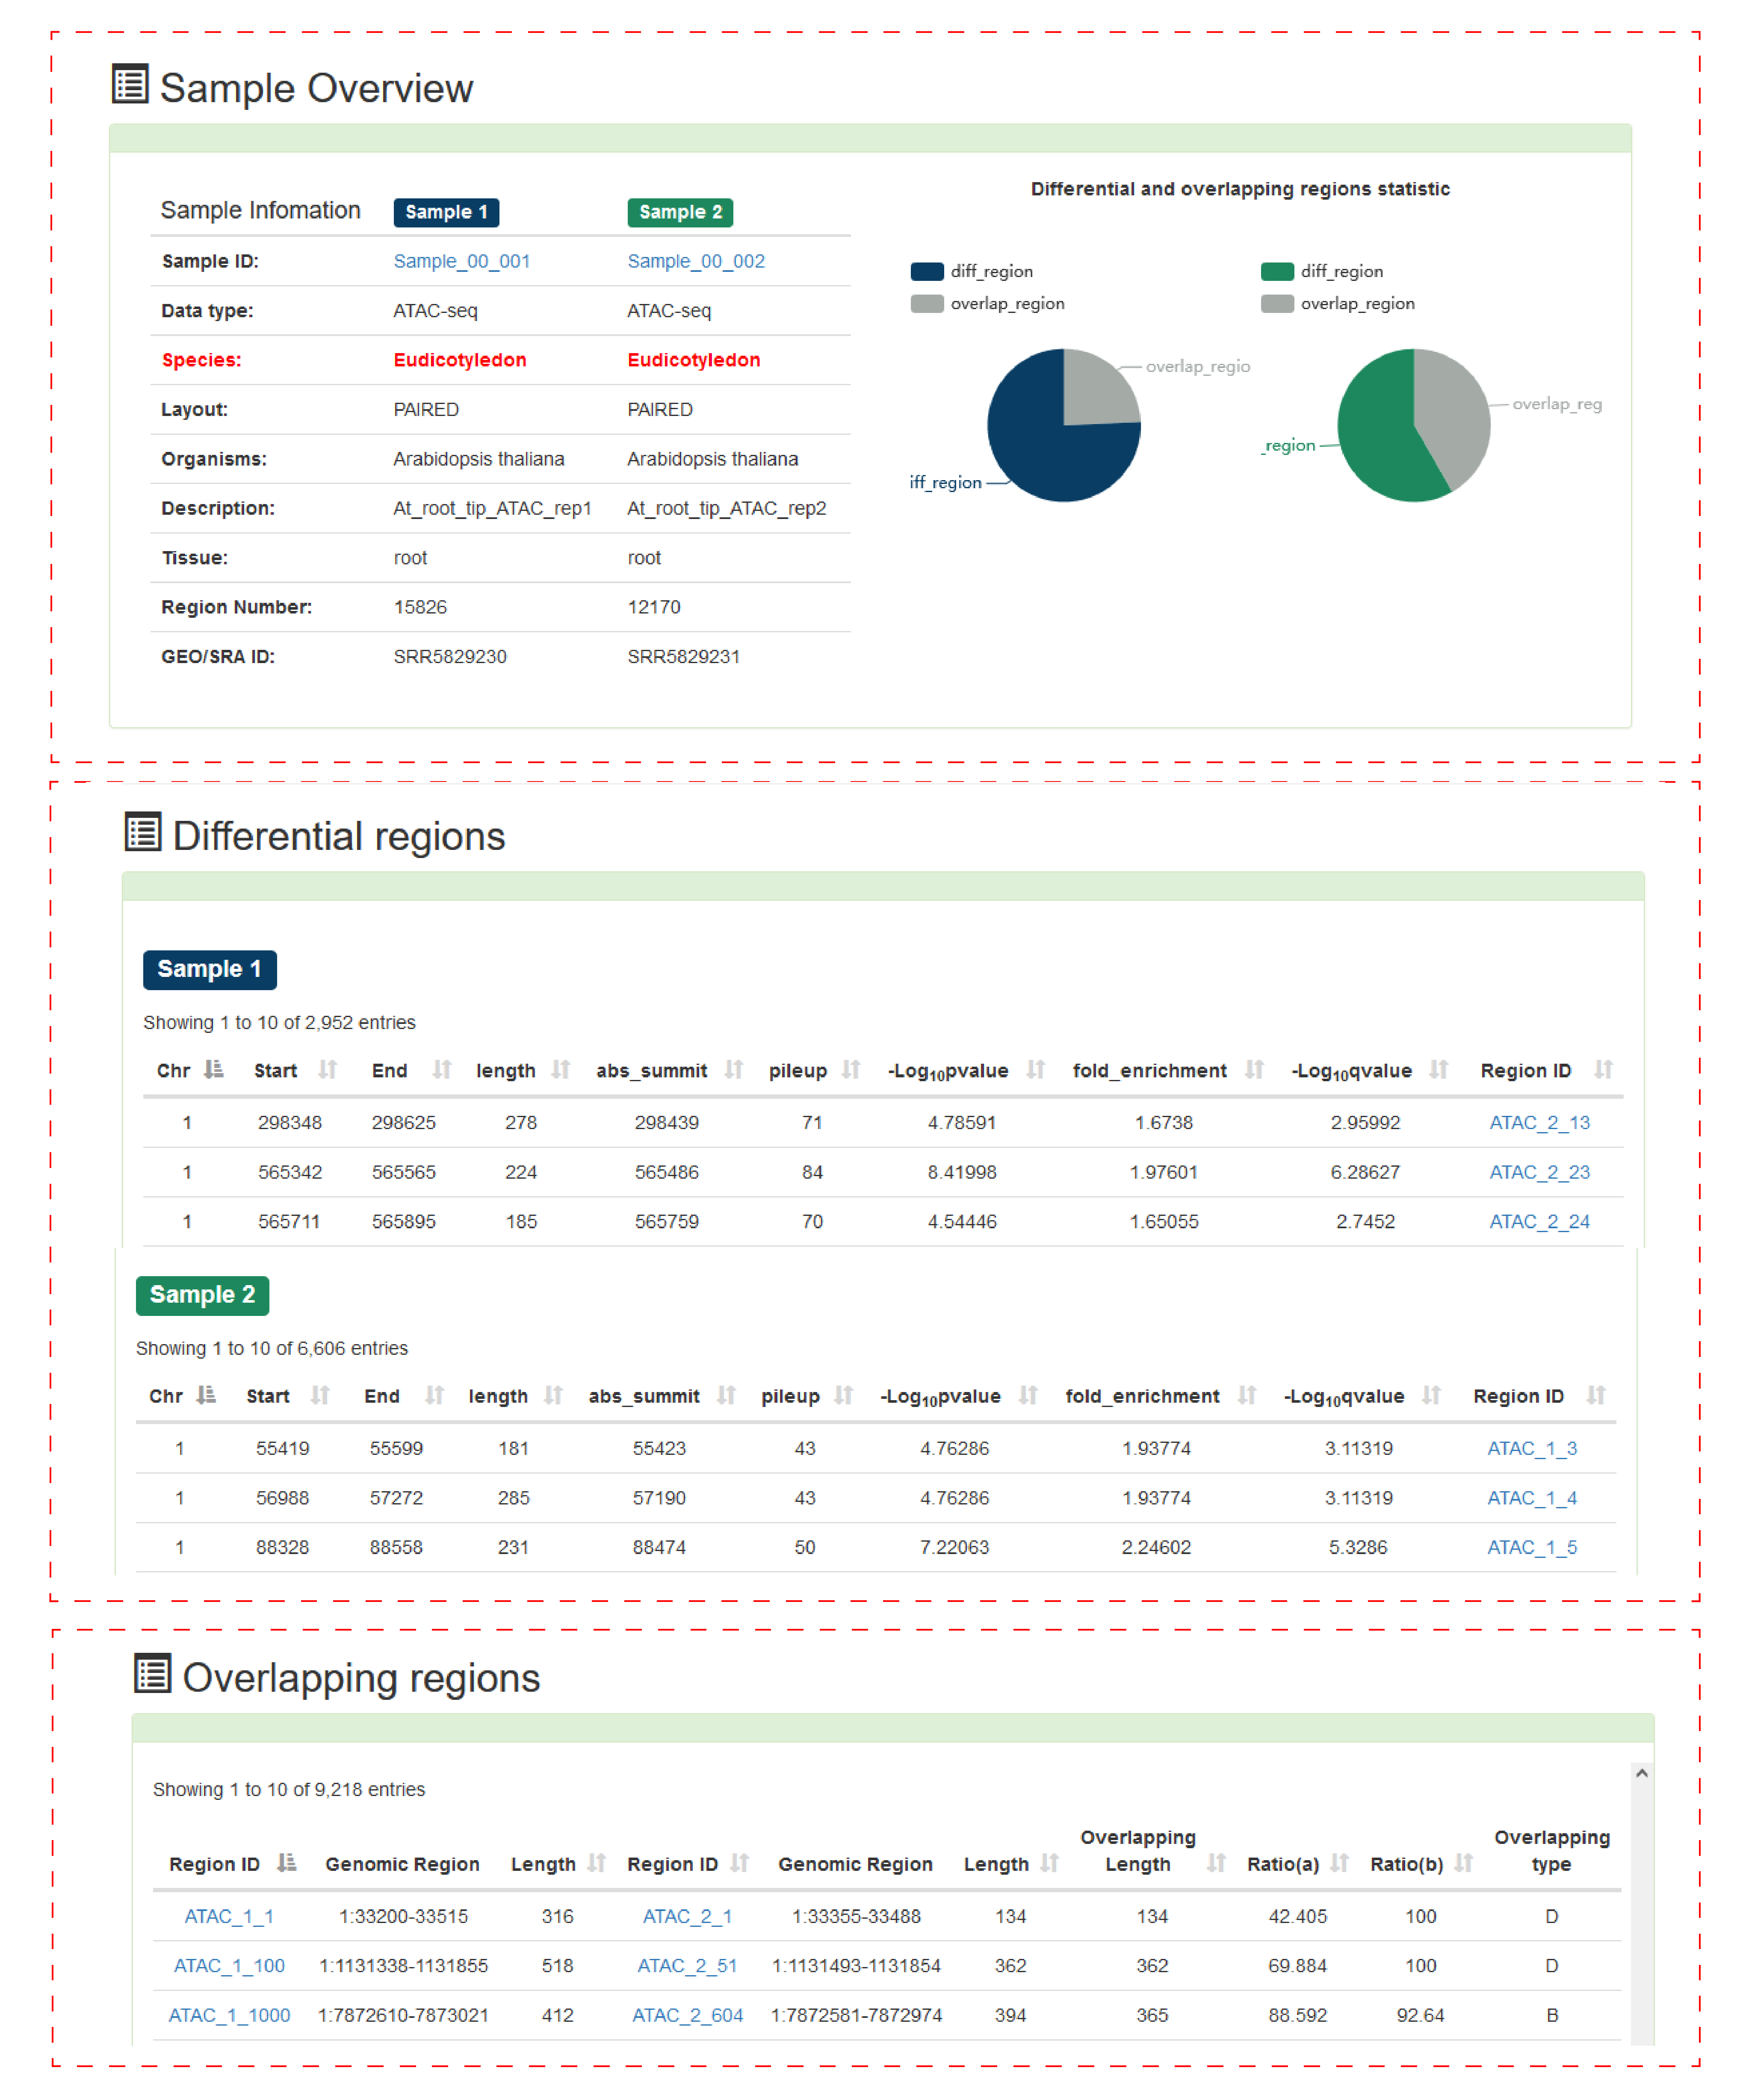
The first is the difference-overlap analysis of the chromatin accessibility area.
Users can submit the "biological sample name" of interest. PlantCADB analyzes the difference between the two samples and overlaps the accessible chromatin area.
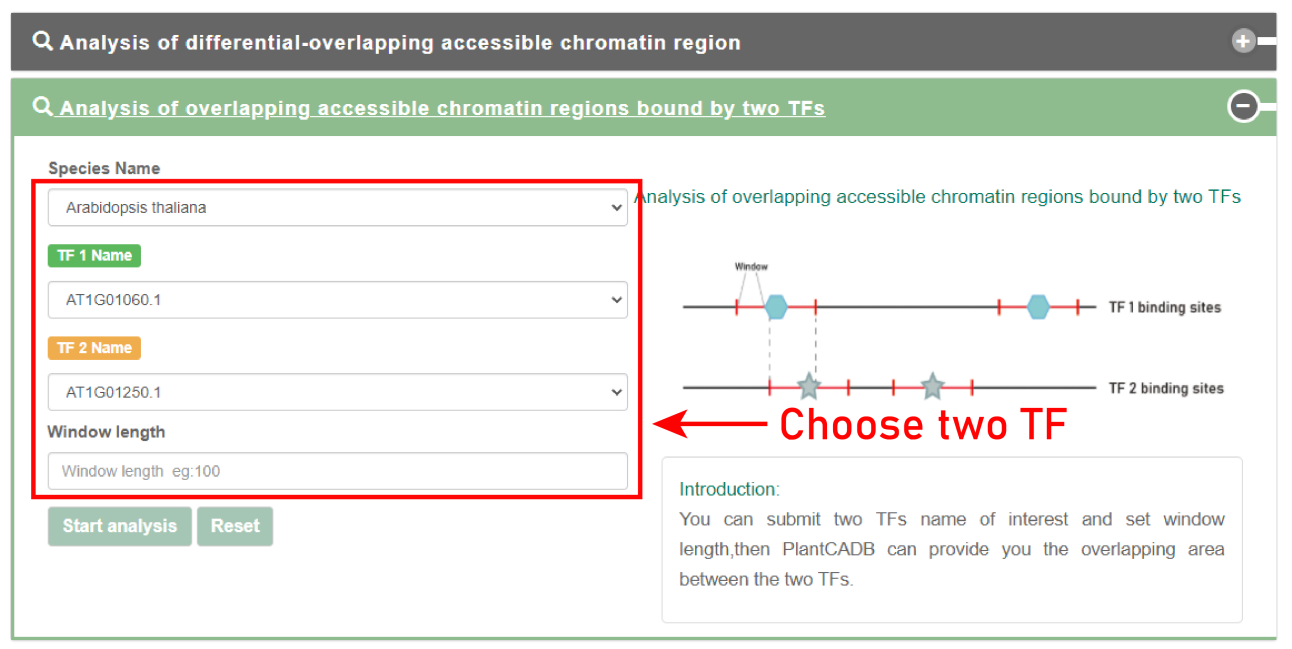
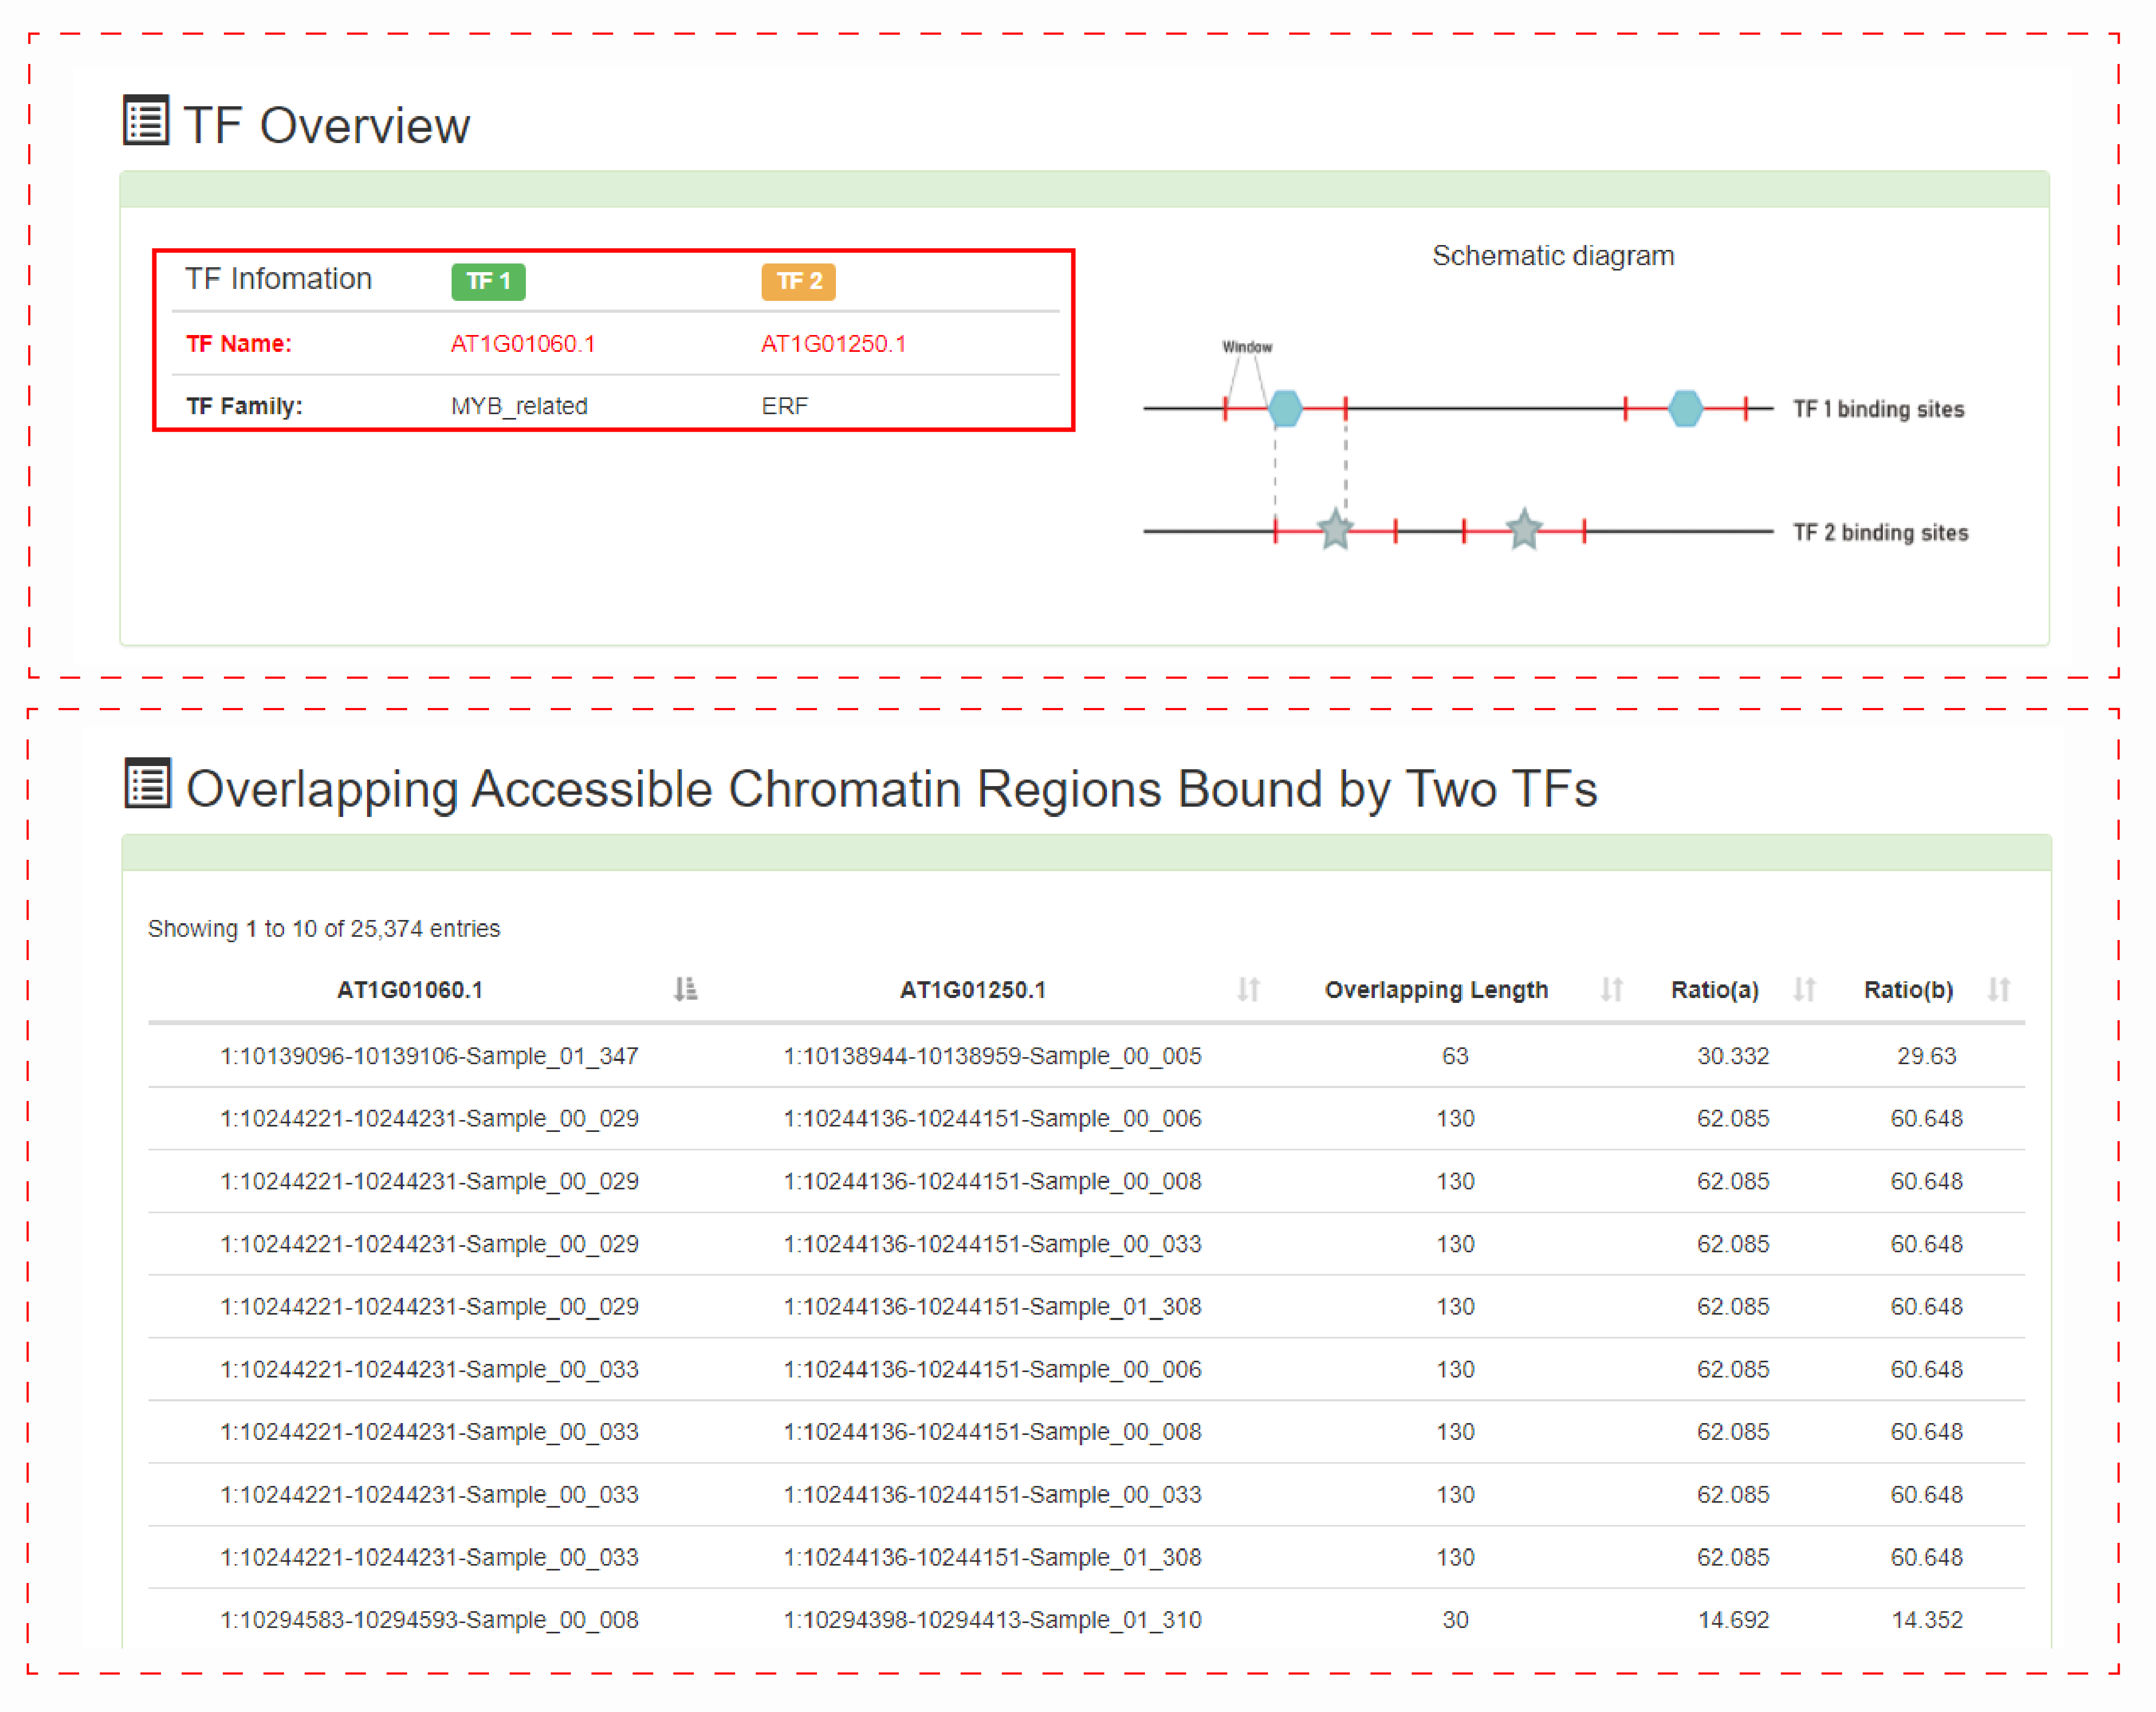
The second is the overlap analysis of accessible chromatin regions bound by two TFs.
Users can submit the name of the TF of interest and extend the window length of the two TF binding sites. PlantCADB will analyze the overlapping accessible chromatin regions bound by the two TFs.
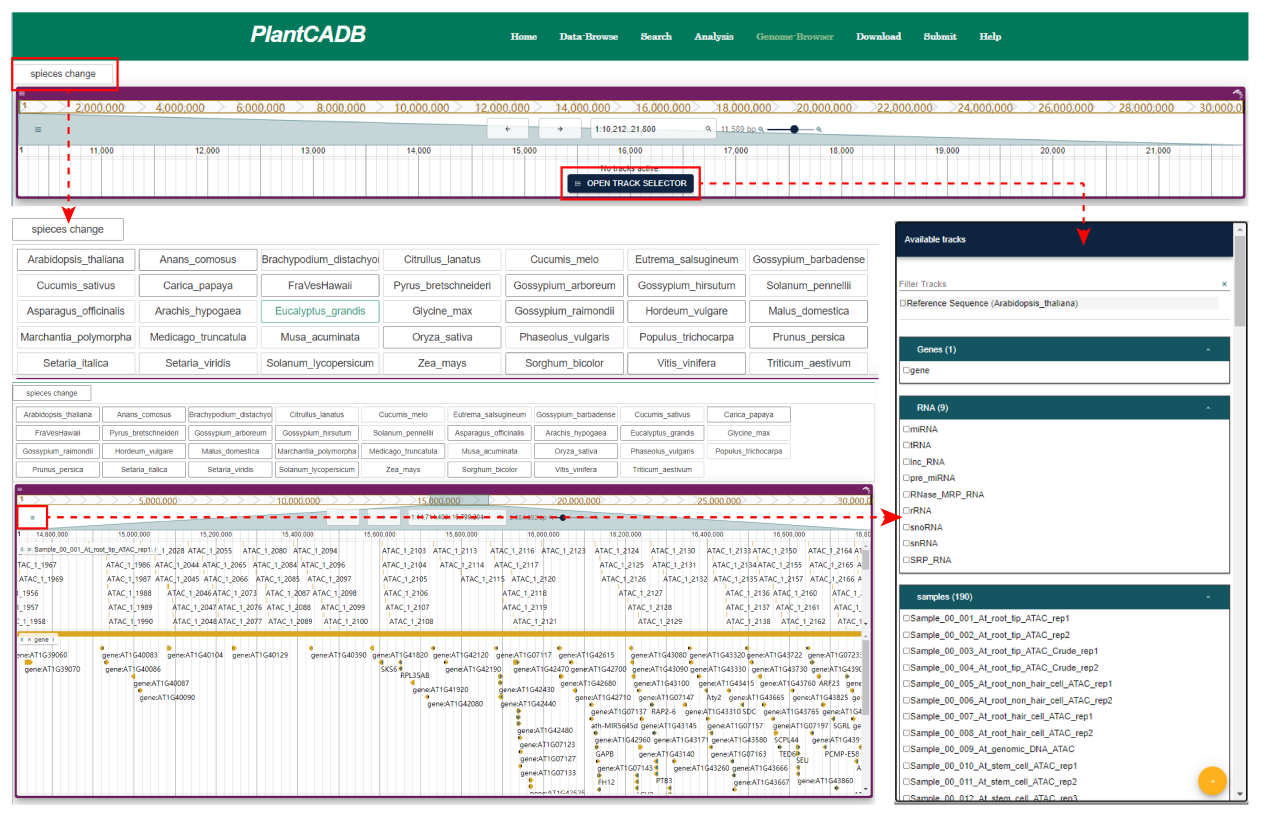
In Genome browser page, we showed the chromatin accessibility regions and gene annotations of 33 species using JBrowser. Users can further visualize the data they are interested in on this page. Gene annotation includes other detailed information such as nearby genes, miRNA, tRNA, lncRNA, etc.
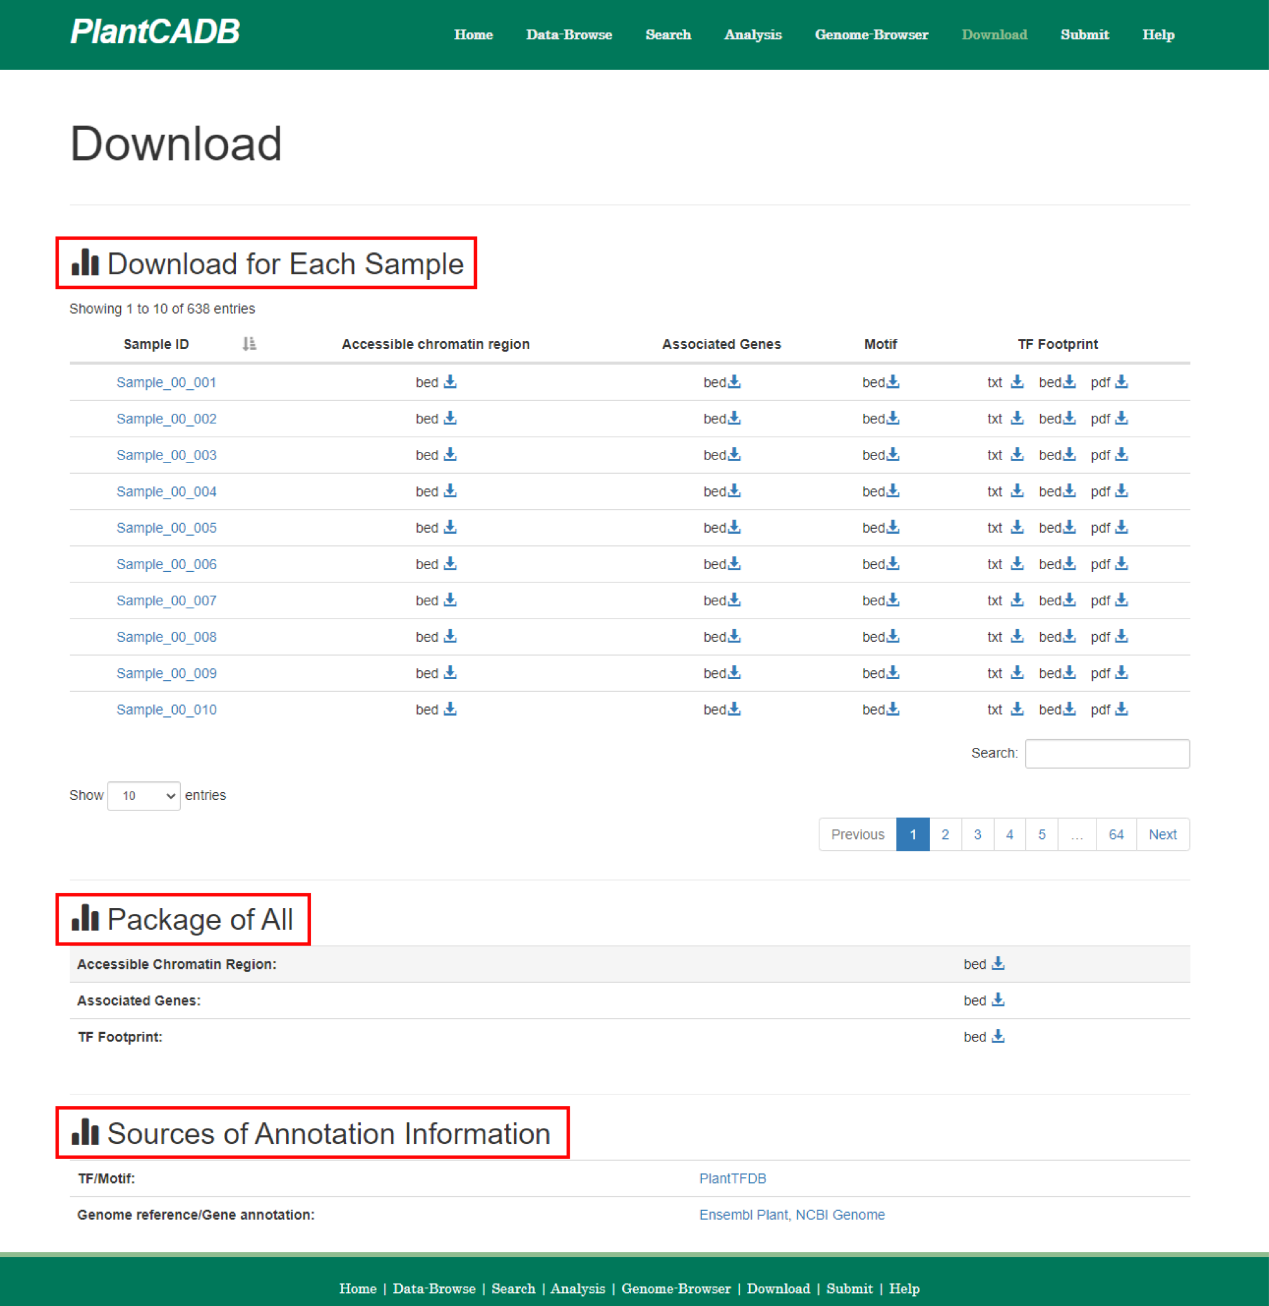
The "Download" page provides chromatin accessibility regions, associated gene annotations, motif scanning, and footprint analysis results data for all samples for download to users. PlantCADB supports the download of .bed format, .csv format, .txt format and .pdf format.
PlantCADB was developed using Java 8 and HTML 5 , finally runs on a Linux-based Apache Web server . The website framework adopts Bootstrap v3.3.7 to design and construction, Ecarts v3.7.0 for data visualization, JQuey v3.6.0 for front-background data interaction, and JBrowse2 browser framework for genome browser. Website can support any browser access to use.